 Originally published at The Hill.
Former President Donald Trump’s proposal to exempt tips from federal income and payroll taxes might sound like a windfall for service workers, but it’s a costly illusion that undermines fair tax policy and economic efficiency. This plan, proposed as legislation by Sen. Ted Cruz (R-Texas), designed to appeal to a crucial voter base, exacerbates inequities and distorts the tax system. There’s a better way. The core problem with exempting tips from taxes is that it narrows the tax base, leading to potential hikes in overall tax rates on tipped workers and everyone else to compensate for deficit spending. A broad tax base with low rates is essential for minimizing economic distortions and spreading the tax burden fairly. Narrowing the base by exempting tips would shift the burden to non-exempt income earners, creating an uneven playing field and violating sound tax policy. This proposal picks tipped workers as winners over everyone else, incentivizing more tipped jobs and payments. Today, nearly every payment app prompts users for tips, a practice that could proliferate further under such a tax exemption. This disrupts consumer behavior and distorts the labor market by artificially boosting the attractiveness of tipped positions over other roles, regardless of the actual economic value they generate. Moreover, this policy would discourage employers from raising the base wages of tipped employees. The federal minimum wage for tipped workers has stagnated at $2.13 per hour since 1991, and making tips tax-exempt might reduce the pressure to increase this base wage by employers, harming the workers it aims to help. Fiscal implications are significant. Estimates suggest exempting tips could reduce federal revenue by $150 to $250 billion over a decade. This shortfall requires higher taxes on other income forms or cuts to public services. Additionally, the potential for increased tax avoidance, as employers and employees reclassify wages as tips, would complicate tax administration and enforcement. A more effective approach would be to make the individual income tax cuts from the 2017 Tax Cuts and Jobs Act permanent, as they expire next year. Coupled with broadening the tax base and lowering rates, this would create a more efficient and equitable tax system. Reducing or eventually eliminating corporate income taxes could stimulate investment and economic growth, benefiting a broader range of Americans. Milton Friedman, the renowned free-market economist, advocated for a broad-based tax system with low rates and minimal exemptions. His philosophy centered on minimizing government intervention and ensuring tax policies do not distort economic decisions. Focusing on permanent tax cuts and broader reforms can create a more robust and fair economic environment that truly benefits all workers. Addressing excessive government spending, which has contributed significantly to our fiscal crisis, is also crucial and missing from Trump’s proposal. Neither Trump nor many Republicans seem to be advocating for significant spending cuts these days. Committing to reducing government expenditures would help manage the fiscal crisis and boost economic growth and prosperity by leaving more resources in the hands of individuals and businesses. While Trump’s proposal might seem appealing, it fails to address deeper issues within the tax system and the labor market for service workers. A broad-based tax system with low rates and minimal exemptions and less government spending is a more equitable and efficient approach that would support more prosperity than exempting tips from federal taxes.
0 Comments
 Originally published at AIER.
The push for a carbon tax has regained popularity as the fiscal storm in 2025 and climate change debates intensify. Advocates claim it’s a solution to pay for spending excesses while reducing greenhouse gas (GHG) emissions. But a carbon tax is a misguided, costly policy that must be rejected. A carbon tax functions more like an income tax than a consumption tax, capturing all forms of work, including capital goods production and building construction. These sectors are heavy on carbon emissions, meaning the tax disproportionately burdens them, stifling investment and innovation — much like a progressive income tax, but with broader economic repercussions. For example, in the US, the construction sector alone accounts for about 40 percent of carbon emissions. A carbon tax would heavily penalize this industry, reducing its capacity to grow, generate new housing, and create jobs. Moreover, implementing a carbon tax involves massive administrative costs. The federal tax code is already complex and costly; a carbon tax would exacerbate these issues. Determining net carbon emissions is a nuanced process subject to ever-changing and arbitrary federal definitions, increasing compliance costs for businesses and consumers. A study by the Tax Foundation found that a carbon tax would cost billions of dollars annually in administrative costs, a burden that would ultimately fall on consumers through higher prices, less economic activity, and fewer jobs. The US economy is already suffering from regulatory costs of $3 trillion annually, including many energy-related restrictions, and the Biden administration has added more than $1.6 trillion in regulatory costs since taking office. One core principle of free-market capitalism is that it comes with limited government. A carbon tax contradicts this principle by expanding governmental regulation of everyday economic activities. The tax revenues would also enable further overspending, though that’s questionable given the supposed purpose of the tax is to reduce carbon emissions and, therefore, the taxes collected. Furthermore, a carbon tax could favor certain production methods over others, disrupting the level playing field that free markets thrive on and leading to inefficiencies and market distortions. The government picks winners and losers by favoring specific methods, undermining competition and economic growth. Renewable energy projects are likely to receive preferential political treatment, skewing investments away from the market’s more efficient, practical technologies. Pigouvian taxes, aimed at correcting negative externalities, are often cited to support a carbon tax. These taxes are named after economist Arthur Pigou and are designed to correct the negative effects of externalities by imposing costs equivalent to the external damage. But they can be counterproductive as they are bound to be the wrong tax rate, distorting economic activity. Carbon taxes fail to account for complex economic interactions and unintended consequences. The PROVE It Act, for instance, proposes a new carbon tax framework but lacks a clear, consistent, and scientifically sound basis for implementation. This uncertainty raises the stakes for economic disruption and consumer cost increases. Another critical issue in the carbon tax debate is ‘who decides?’ Climate science is ever evolving, and economic models predicting the outcomes of carbon taxes are fraught with uncertainties. Placing high costs on consumers based on unsettled science and unpredictable economic impacts is not a prudent policy approach. We should promote voluntary measures and technological advancements that naturally reduce emissions through market activity. Importantly, the EPA does not consider carbon dioxide a harmful pollutant in the traditional sense, as it is essential for life. We need carbon dioxide to breathe and enjoy a fulfilling life. This further questions the rationale behind taxing carbon emissions, as it imposes undue economic strain in an attempt to regulate a naturally occurring and necessary element. Even if America hadn’t been doing better than other countries that joined the Paris Treaty for goals on carbon emissions, China (and India) aren’t interested, thereby putting more of the unnecessary cost of reducing these emissions on Americans. Moreover, the cost of carbon taxes can be significant. Increasing production costs leads to higher prices for goods and services, disproportionately affecting low- and middle-income households — especially when they already suffer from high inflation. This regressive nature undermines its purported environmental benefits, placing a heavier burden on those least able to afford it. For example, a $50-per-ton carbon tax could increase household energy costs by up to $300 annually, hitting hardest those who can least afford it. Countries implementing carbon taxes, like some in Europe, have seen mixed results. Emissions reductions have been minimal, while economic growth has been hampered. These policies often result in job losses and decreased global competitiveness, showcasing the unintended consequences of such interventions. For instance, France’s carbon tax led to widespread protests and economic disruption, illustrating such policies’ social and economic challenges. While the intention behind a carbon tax — to reduce American GHG emissions in an effort to combat global climate change — is questionable in itself, the economic realities and principles of free-market economics prove it is a flawed approach. With the fiscal storm likely coming next year, Congress should just say no to the PROVE It Act and the carbon tax in general. The bottom line is that increasing the government’s footprint through such a tax is neither conservative nor market-oriented. Instead, we should focus on market-driven solutions that encourage innovation and efficiency without imposing heavy-handed regulations.  Originally published at Kansas Policy Institute.
Kansas has been simmering in economic stagnation for decades, trailing behind national averages in job growth, population increases, and economic growth. Like a poorly tended grill, high taxes and selective business subsidies have smoked out potential growth, leaving stagnation rather than sustenance. From 1979 to 2022, Kansas’s private job growth was just 53% compared to the national average of 88%. Imagine the vibrancy of having an additional 451,000 jobs in the state—jobs that could have been fostered with more competitive tax policies. Kansas has seen a net exodus of nearly 198,000 residents since 2000, driven away by an unwelcome tax environment. The states with the lowest tax burdens saw an influx of 4.6 million people from domestic migration during the same period, while the high-tax states watched 10.7 million residents pack up and leave. According to recent IRS data, Kansas lost $2.1 billion in adjusted gross income due to people moving elsewhere since 2017. The Kansas Policy Institute’s Green Book shows per capita spending of $4,941 in 2022 was substantially higher than in states with no personal income taxes ($3,283) and the ten best economic performance ($3,543). States with lower tax burdens have had better job growth and economic activity. Between 1998 and 2022, the ten states with the lowest state and local tax burdens averaged 51% growth in private-sector employment versus 34% for the ten states with the highest burdens. Kansas, ranked 44th during this period, achieved just 16% growth. Furthermore, Kansas’s high spending per person translates to higher taxes, ultimately burdening its citizens and hampering economic growth. More recently, Kansas’s unemployment rate ticked up to 2.9% in May 2024, a slight increase but a revealing one. The total nonfarm payroll employment saw a marginal uptick by 100 jobs. Beneath this weak report, there was more weakness as the private sector lost 300 jobs while the government added 400 jobs. This isn’t growth; it’s a reshuffle at a high cost to private-sector workers. Over the past year, Kansas has seen an overall increase of 24,000 jobs, with the private sector contributing 18,700 and the government sector adding 5,300, or about 20% of the total. During the recent special session, the Legislature passed several measures to boost the state’s economic prospects. One notable legislative action was passing a multi-billion dollar STAR bond to attract major sports franchises, especially the Chiefs and Royals from Missouri, just a few miles away. Investing in sports is like predicting Kansas weather—unpredictable and always exciting. There is potential for economic rain, but this will likely put you in a financial storm instead. Moreover, the recent special session saw efforts to provide broad tax relief, with the key being reducing tax brackets from three to two, which is a correct step toward a flat income tax. These changes could significantly impact Kansas’s economic landscape, reducing the tax burden and potentially helping grow the economy. However, the effectiveness of these measures will depend heavily on their implementation and the accompanying fiscal restraint. Flattening the income tax would transform Kansas from a flyover state into a destination. This move would simplify the tax code, making it fairer and less of a headache—because the only thing Kansans should worry about rising are the sunflowers. Kansas has also flirted with property tax relief with KPI promoting a constitutional amendment to limit appraisal valuation increases, which has broad support. The same or separate constitutional amendments should limit property tax levies, which cover the product of appraisals and tax rates, and cap state and local government spending to the rate of population growth plus inflation. The latter would best limit the true burden of government in the form of spending, providing predictability and stability for homeowners and businesses alike. Kansas is sitting on a $4 billion reserve—it’s like having a savings account when you’re deep in credit card debt. Responsible budgeting ensures fiscal sustainability and prevents the state from falling into the cycles of budget shortfalls and hasty tax hikes that have plagued it in the past. By following this approach, over-collected taxpayer money called a “surplus,” can be returned by cutting a flat income tax rate. This can be achieved by spending on essential services outlined in the state’s constitution, providing opportunities for strategic budget cuts and growth of no more than the rate of population growth plus inflation. This balanced approach helps ensure fiscal sustainability without compromising essential services. By implementing bold tax reforms and adopting a disciplined approach to spending, Kansas can pave the way for a prosperous future. These measures will create an environment conducive to job creation and economic competitiveness, ensuring that Kansas becomes a place where businesses thrive, and residents enjoy a higher quality of life.  Government Spending Is The Problem The late, great economist Milton Friedman said, "The real problem is government spending." This is true as spending comes before taxes or regulations. In fact, if people didn't form a government or politicians didn’t create new programs, then there would be no need for government spending and no need for taxes. And if there was no government spending nor taxes to fund spending then there would be no one to create or enforce regulations. While this might sound like a utopian paradise, which I agree, there are essential limited roles for governments outlined in constitutions and laws. Of course, most governments are doing much more than providing limited roles that preserve life, liberty, and property. This is why I have long been working diligently for more than a decade to get a strong fiscal rule of a spending limit enacted by federal, state, and local governments promptly under my calling to "let people prosper," as effectively limiting government supports more liberty and therefore more opportunities to flourish. Fortunately, there have been multiple state think tanks that have championed this sound budgeting approach through what they've called either the Responsible, Conservative, or Sustainable State Budget. I recently worked with Americans for Tax Reform to publish the Sustainable Budget Project, which provides spending comparisons and other valuable information for every state. This groundbreaking approach was outlined recently in my co-authored op-ed with Grover Norquest of ATR in the Wall Street Journal. When Did This Budget Approach Begin? I started this approach in 2013 with my former colleagues at the Texas Public Policy Foundation with work on the Conservative Texas Budget. The approach is a fiscal rule based on an appropriations limit that covers as much of the budget as possible, ideally the entire budget, with a maximum amount based on the rate of population growth plus inflation and a supermajority (two-thirds) vote to exceed it. A version of this approach was started in Colorado in 1992 with their taxpayer's bill of rights (TABOR), which was championed by key folks like Dr. Barry Poulson and others. (picture below is from a road sign in Texas)  Why Population Growth Plus Inflation? While there are many measures to use for a spending growth limit, the rate of population growth plus inflation provides the best reasonable measure of the average taxpayer's ability to pay for government spending without excessively crowding out their productive activities. It is important to look at this from the taxpayer’s perspective rather than the appropriator’s view given taxpayers fund every dollar that appropriators redistribute from the private sector. Population growth plus inflation is also a stable metric reducing uncertainty for taxpayers (and appropriators) and essentially freezes inflation-adjusted per capita government spending over time. The research in this space is clear that the best fiscal rule is a spending limit using the rate of population growth plus inflation, not gross state product, personal income, or other growth rates. In fact, population growth plus inflation typically grows slower than these other rates so that more money stays in the productive private sector where it belongs. To get technical for a moment, personal income growth and gross state product growth are essentially population growth plus inflation plus productivity growth. There's no reasonable consideration that government is more productive over time, so that term would be zero leaving population growth plus inflation. And if you consider the productivity growth in the private sector, then more money should be in that sector at the margin for the greatest rate of return, leaving just population growth plus inflation. Population growth plus inflation becomes the best measure to use no matter how you look at it. Given the high inflation rate more recently, it is wise to use the average growth rate of population growth plus inflation over a number of years to smooth out the increased volatility (ATR's Sustainable Budget Project uses the average rate over the three years prior to a session year). And this rate of population growth plus inflation should be a ceiling and not a target as governments should be appropriating less than this limit. Ideally, governments should freeze or cut government spending at all levels of government to provide more room for tax relief, less regulation, and more money in taxpayers' pockets. Overview of Conservative Texas Budget Approach Figure 1 shows how the growth in Texas’ biennial budget was cut by one-fourth after the creation of the Conservative Texas Budget in 2014 that first influenced the 2015 Legislature when crafting the 2016-17 budget along with changes in the state’s governor (Gov. Greg Abbott), lieutenant governor (Lt. Gov. Dan Patrick), and some legislators. The 8.9% average growth rate of appropriations since then was below the 9.5% biennial average rate of population growth plus inflation since then, which this was drive substantially higher after the latest 2024-25 budget that is well above this key metric (before this biennial budget the growth rate was 5.2% compared with 9.4% in the rate of population growth plus inflation). 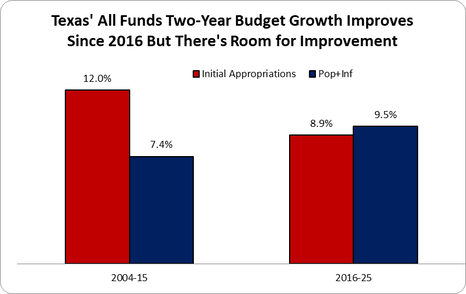 This approach was mostly put into state law in Texas in 2021 with Senate Bill 1336, as the state already has a spending limit in the constitution. The bill improved the limit to cover all general revenue ("consolidated general revenue") or 55% of the total budget rather than just 45% previously, base the growth limit on the rate of population growth times inflation instead of personal income growth, and raise the vote from a simple majority to three-fifths of both chambers to exceed it instead of a simple majority. There are improvements that should be made to this recent statutory spending limit change in Texas, such as adding it to the constitution and improving the growth rate to population growth plus inflation instead of population growth times inflation calculated by (1+pop)*(1+inf). But this limit is now one of the strongest in the nation as historically the gold standard for a spending limit of the Colorado's Taxpayer Bill of Rights (TABOR) has been watered down over the years by their courts and legislators, as it currently covers just 43% of the budget instead of the original 67%. My Work On The Federal Budget In The White House From June 2019 to May 2020, I took a hiatus from state policy work to serve Americans as the associate director for economic policy ("chief economist") at the White House's Office of Management and Budget. There I learned much about the federal budget, the appropriations process, and the economic assumptions which are used to provide the upcoming 10-year budget projections. In the President's FY 2021 budget, we found $4.6 trillion in fiscal savings and I was able to include the need for a fiscal rule which rarely happens (pic of President Trump's last budget).  Sustainable Budget Work With Other States and ATR When I returned to the Texas Public Policy Foundation in May 2020, as I wanted to get back to a place with some sense of freedom during the COVID-19 pandemic and to be closer to family, I started an effort to work on this sound budgeting approach with other state think tanks. This contributed to me working with many fantastic people who are trying to restrain government spending in their states and the federal levels. Here are the latest data on the federal and state budgets as part of ATR's Sustainable Budget Project. From 2014 to 2023, the following happened: Federal spending increased by 81.7%, nearly four times faster than the 23.1% increase in the rate of population growth plus inflation.
Result: American taxpayers could have been spared more than $2.5 trillion in taxes and debt just in 2023 if federal and state governments had grown no faster than the rate of population growth plus inflation during the previous decade. And this would be even more if we considered the cumulative savings over the period.  My hope is that if we can get enough state think tanks to promote this budgeting approach, get this approach put into constitutions and statutes, and use it to limit local government spending as well, there will be plenty of momentum to provide sustainable, substantial tax relief and eventually impose a fiscal rule of a spending limit on the federal budget. This is an uphill battle but I believe it is necessary to preserve liberty and provide more opportunities to let people prosper. Sustainable State Budget Revolution Across The Country Below are the states and think tanks which I'm working with and this revolution is going, which you can find an overview of this budgeting approach in Louisiana and should be applied elsewhere. I update these periodically, successful versus not successful budgeting attempts being 20-7 so far.
If you're interested in doing this in your state, please reach out to me. For more details, check out these write-ups on this issue by Grover Norquist and I at WSJ, Dan Mitchell at International Liberty, and The Economist.  Originally published at Kansas Policy Institute.
As Kansas gears up for a special legislative session in two weeks, the state stands at a pivotal point. Governor Laura Kelly’s call to reconvene the legislature after vetoing three key tax relief bills this year, let alone what she vetoed previously, indicates the struggle to pass pro-growth policies. For Kansas to thrive, it must pursue significant income tax reductions complemented by responsible budgeting. Despite an appealing low unemployment rate of 2.8%, a deeper look at Kansas’ labor statistics reveals significant challenges. The labor force participation rate, the share of residents either working or actively looking for work, has dropped to a historic low of 66.1% since 1977, and the workforce has been flat since 2008. This stagnation points to a need for reform policies that do more than temporarily boost employment numbers—they must encourage sustainable work and investment. Current tax relief discussions, including proposals to eliminate the state’s 2% sales tax on groceries, reduce the current 20 mill state property tax levy for K12 education, and end the state income tax on Social Security benefits, though politically attractive, do not provide the necessary economic improvements as cutting personal income taxes:
In contrast, flattening and cutting income taxes would dramatically improve Kansas’s economic environment. As noted in a recent report by The Buckeye Institute for KPI, this sort of pro-growth tax policy in Kansas would make the state more attractive to entrepreneurs and skilled workers, fostering an ecosystem ripe for innovation and investment that increases economic growth and job creation across sectors, contributing to a wider tax base and more tax collections. Kansas must also embrace responsible budgeting for these tax cuts to be sustainable. The state should learn from the lesson of excessive spending during the last decade’s troubles, which led to deficits and foolish tax hikes. This can be achieved by spending on only limited roles outlined in the state’s constitution, providing opportunities for strategic budget cuts and growth of no more than the rate of population growth plus inflation. This balanced approach helps ensure fiscal sustainability without compromising essential services. The upcoming special session is a golden opportunity to initiate significant economic reforms. By adopting bold income tax cuts and responsible budgeting, Kansas can set a prosperity cycle that benefits all residents. This approach goes beyond temporary fixes to establish a solid foundation for future economic stability and growth, which can’t be achieved with the other proposals. Now is the time to implement visionary reforms that position Kansas as a smart, growth-oriented fiscal policy leader. This special session is ideal for Kansas to boldly step into a future marked by robust economic health and lasting prosperity. By seizing this moment to enact significant tax cuts and set the table for disciplined spending, Kansas can ensure its competitiveness and prosperity for generations. Let this session be remembered when Kansas took bold steps to secure its economic future, setting a precedent for fiscal responsibility and proactive economic strategies that lead to a flourishing state.  Originally published at The Center Square.
Iowa Gov. Kim Reynolds and the Republican-led Legislature have emphasized conservative budgeting as a central priority. Such prudence in budgeting is the cornerstone of fiscal conservatism, and the recent passage of the FY 2025 budget in Iowa highlights a commitment to fiscal restraint, albeit less stringent than in previous sessions. The newly approved $8.9 billion FY 2025 General Fund budget marks a 4.7 percent increase from the previous fiscal year's $8.5 billion, demonstrating moderate fiscal growth. Historically, spending has been recommended to align with the combined rates of population growth and inflation. Based on this formula, the FY 2024 budget of $8.5 billion should ideally have capped the FY 2025 spending at $8.8 billion. Adhering to such metrics ensures that the budget reflects the average taxpayer's ability to fund it, a fundamental principle that should guide all budgetary decisions. This year, however, the legislature has ventured slightly beyond this benchmark, underscoring the careful balance between fiscal responsibility and the needs of a growing state. To provide substantial relief to individual taxpayers, the legislature has implemented a significant income tax cut, which accelerates the implementation of a 3.8 percent flat tax in 2025. This measure is projected to save taxpayers over $1 billion. The tax relief directly benefits Iowans, putting more money back into their pockets and supporting more economic growth. Despite concerns from critics who argue that such fiscal strategies could undermine public services, the FY 2025 budget demonstrates that the government is not retrenching but rather growing at a deliberate pace. Education remains a top priority, accounting for 56 percent of the budget. When combined with the allocations to the Department of Human Health Services (DHHS), these two areas consume a significant 81 percent of the General Fund. While this concentration of funds reflects the importance placed on these sectors, it also highlights the challenges of allocating resources to other critical areas, such as public safety and the judicial system, which have only seen modest increases. The practice of conservative budgeting is further evidenced by the state's adherence to its legal spending cap, which allows up to 99 percent of projected revenue to be used. In contrast, the FY 2025 budget only commits 92 percent of these projections, reinforcing Iowa's fiscal discipline. This cautious approach is proving effective, as evidenced by the substantial budget surpluses recorded in recent years, including a $1.8 billion surplus in FY 2023, with similar surpluses anticipated for FY 2024 and FY 2025. Looking ahead, legislators must remain vigilant to ensure that conservative budgeting principles continue to guide fiscal policy. State Sen. Jason Schultz rightly points out the interdependence of tax policy and spending, “Both Republicans and Democrats need to realize that tax policy is affected by spending. And when you start seeing spending creeping up for annual, year after year, new good ideas, you can’t have good tax policy.” Strengthening Iowa's 99 percent spending limitation would provide a robust mechanism to curb future expenditure desires. This could be done by changing the law and enshrining it in the Constitution to bind spending increases to no more than the rate of population growth plus inflation. Iowa’s fiscal approach starkly contrasts the situations unfolding in neighboring states like Minnesota and Illinois or others such as New York and California. Higher spending and taxes in these progressive states contribute to economic challenges and drive more people away. The message is clear: unsustainable increases in spending can lead to severe consequences. Iowa's success in maintaining fiscal discipline through conservative budgeting and responsible tax policies is a testament to the effectiveness of this approach. Iowa’s unwavering commitment to conservative budgeting and responsible tax policies is the cornerstone of its fiscal strategy, ensuring the state remains a model of stability and prosperity. By striking a balance between providing essential services and fostering economic growth, Iowa sets a commendable example of how sustainable fiscal policies can safeguard a state’s financial health and support the well-being of its citizens.  Originally published at Kansas Policy Institute.
As states across America sharpen their competitive edges with tax cuts and simpler tax codes, Kansas has a unique opportunity to foster prosperity and economic resilience. The tax reform bill with about $635 million in personal income tax relief in the first year awaits Governor Laura Kelly’s signature. While this bill is not as good as the one with a flat 5.25% tax rate passed earlier this year but vetoed by Governor Kelly, the latest bill would help better align the state with successful tax reforms nationwide that have spurred growth and investment. Governor Kelly would be wise to sign it or risk losing the opportunity for people to flourish across the state. But her recent equivocations do not suggest she’s likely to side with Kansas families. The Urgency of Tax Reform Earlier this month, HB 2036 overwhelmingly passed the House and Senate. The bill seeks to overhaul the state’s current tax structure by simplifying the brackets and reducing financial burdens on Kansans. The essence of the reform is to streamline the number of tax brackets from three to two, simplifying the tax filing process and reducing administrative costs. This reform is not just a fiscal adjustment; it’s a strategic move toward making Kansas more competitive and prosperous. The proposed changes in tax brackets will make the tax system easier to navigate and less burdensome. But the legislation doesn’t stop at restructuring brackets; it also includes several key features designed to benefit Kansas residents directly:
This restructuring will leave more money in Kansans’ pockets, fostering increased consumer spending and investment that will help support sustained increases in economic growth and new hires. National Trends in Tax Reform Kansas is not alone in its move toward income tax simplification and reduction. In 2024, fourteen other states thus far, had income tax cuts, enhancing their economic landscapes and making them more attractive for business investments and skilled workers. Here’s a map highlighting the states that have implemented income tax cuts this year: This national movement underscores the importance of Kansas keeping pace with these trends. Failing to do so could deter potential investment and encourage businesses and talent to move to more tax-friendly states. This is especially true given how neighboring states are cutting taxes. The Vision of Fiscal Responsibility and Economic Freedom In an unpredictable economy, Kansas can improve the fiscal landscape through tax reform and sustainable budgeting. Adhering to a “Responsible Kansas Budget,” which changes the budget every year by no more than the rate of population growth plus inflation, and using resulting surpluses to reduce income tax rates annually would help flatten and eventually eliminate these taxes. This strategic approach promises a robust economic future, minimizing the need for burdensome taxation. Economic Context: Kansas vs. Other States The contrast in economic performance is stark when comparing Kansas with nearby states and those with and without income taxes. Here’s a snapshot of economic performance among these states. This data proves that those states without income taxes perform better economically regarding job growth and wage growth, two key ingredients for reducing poverty and encouraging prosperity. Moreover, those states without personal income taxes have substantially less government spending, which helps reduce the burden of government on residents. Kansas will substantially improve its current trajectory by following the path of those states that are flattening, lowering, and eliminating personal income taxes. Not Perfect, But Good Step Forward It’s time for sustainable tax reform after the issues during the last decade of overspending, which resulted in higher taxes later. The Legislature’s passed tax reform is crucial for Kansas to provide the following:
The proposed tax relief of more than $600 million is needed in Kansas today. A recent economic analysis by the Economic Research Center at the Buckeye Institute of a $500 million income tax relief package. Their findings show that Kansas could have a $430 million (2012 dollars) increase in GDP, $240 million more in business investment, $200 million more in consumption, and 1,000 more jobs in the first year and more growth after that. Gov. Kelly and the legislature should learn the key lesson from the Brownback years – you cannot cut taxes and increase spending. The plan on Gov. Kelly’s desk is eminently affordable if all parties involved learn from this lesson and have the discipline to act on it. Governor Kelly’s signature would mark a significant step forward, positioning Kansas among the leading states with proactive fiscal policies that spur growth and enhance quality of life. This tax reform and responsible spending will help ensure that Kansas does not fall behind its peers but moves forward as a leader in economic health and resident well-being. It would also set the stage for a flat income tax and eventually eliminate it by returning surplus dollars to taxpayers where it is most productive.  Originally published at AIER.
April heralds two markers in Americans’ financial calendar. Neither brings joy. Their anguish reminds us of the dire need for fiscal reform before it’s too late. The first day is Tax Day on April 15, when you must file taxes to the IRS. The other day is Tax Freedom Day on April 16. The latter is the 104th day of the year, which represents when Americans, on average, can stop working to pay taxes and start working to improve their own lives and further their economic goals. We work 30 percent of our days to pay government alone. This stark division of the year into earning to pay for the government versus for oneself casts a revealing light on taxation’s burden. These dismal dates indicate an urgent need to overhaul the fiscal regime of excessive government spending that drives taxes higher. The pain and uncertainty from an ever-changing federal progressive marginal individual income tax system with forced withholding and payment or refund later are destructive. These costs distort our ability to prosper. Central to minimizing these burdens and distortions is for the federal government to spend less, thereby reducing the amount needed from taxes. And the tax system should be simplified by moving to a broad-based, flat-income tax. Eventually, we could eliminate income taxes and fund our significantly reduced spending with a broad-based, flat final sales tax, but politics too often takes precedence over prudence. States without personal income taxes, such as Texas and Florida, often showcase stronger economic performance, underscoring the potential benefits of a consumption-based tax model. The Tax Foundation’s analysis shows that these states enjoy higher growth rates and attract businesses and residents alike, advocating for the efficiency of a less burdensome tax system. Unlike taxes on income, a consumption tax better aligns with economic volatility and taxpayers’ decisions. It introduces a transparent, simpler tax system, starkly contrasting the current convoluted income tax code, thereby supporting more freedom to choose, increased savings, and faster economic growth. But the looming uncertainty inevitably generated by temporary tax measures and seemingly endless, excessive government spending demands attention. For instance, the individual income tax rate reductions, full-expensing, and other provisions of the Tax Cuts and Jobs Act (TCJA) of 2017 expire over the next year, creating a cloud of uncertainty. Moreover, the multi-trillion-dollar deficits from overspending result in further economic destruction because of higher interest rates and less investment. The economic impact was notable, with the Congressional Budget Office reporting a surge in GDP growth following the TCJA’s implementation. But the uncertainty surrounding its future dampens long-term economic prospects and investments. Permanent tax reform, aimed at fostering stability and growth, requires a commitment to fiscal discipline and a reevaluation of government spending priorities. The erratic nature of such spending and tax policies erodes the stability crucial for economic prosperity. Uncertainty, particularly around taxes, inhibits investment and innovation. Predictability is key to strategic planning and growth. For entrepreneurs, uncertainty is a strong disincentive. The fluctuating tax landscape presents a significant barrier to economic expansion. Addressing this uncertainty requires permanent growth-oriented tax policies and controlling government spending. The direction of tax reform must be twofold: advocating for broad-based, flat taxes and championing sustainable government budgets. This dual approach promises to enhance economic liberty and lay a foundation for robust growth, which should also reduce the number of days to Tax Freedom Day so more money is in our pockets. Reflecting on Tax Day and Tax Freedom Day sparks a broader discussion on tax reform. We can envision a society that values freedom, peace, and prosperity by championing pro-growth policies of a simplified, flat tax system and sustainable spending. Dispelling tax uncertainties and controlling government spending pave the way for economic policies that foster rather than hinder human flourishing. The journey toward a more rational tax system is not merely fiscal; it’s a moral imperative. It demands bold, persuasive advocacy for policies that champion economic soundness while embracing the principles of liberty and opportunity. We can inspire a movement toward genuine economic reform on this Tax Day by addressing the challenges posed by the current tax code and advocating for a shift toward a better fiscal regime with more days working for ourselves instead of Uncle Sam. 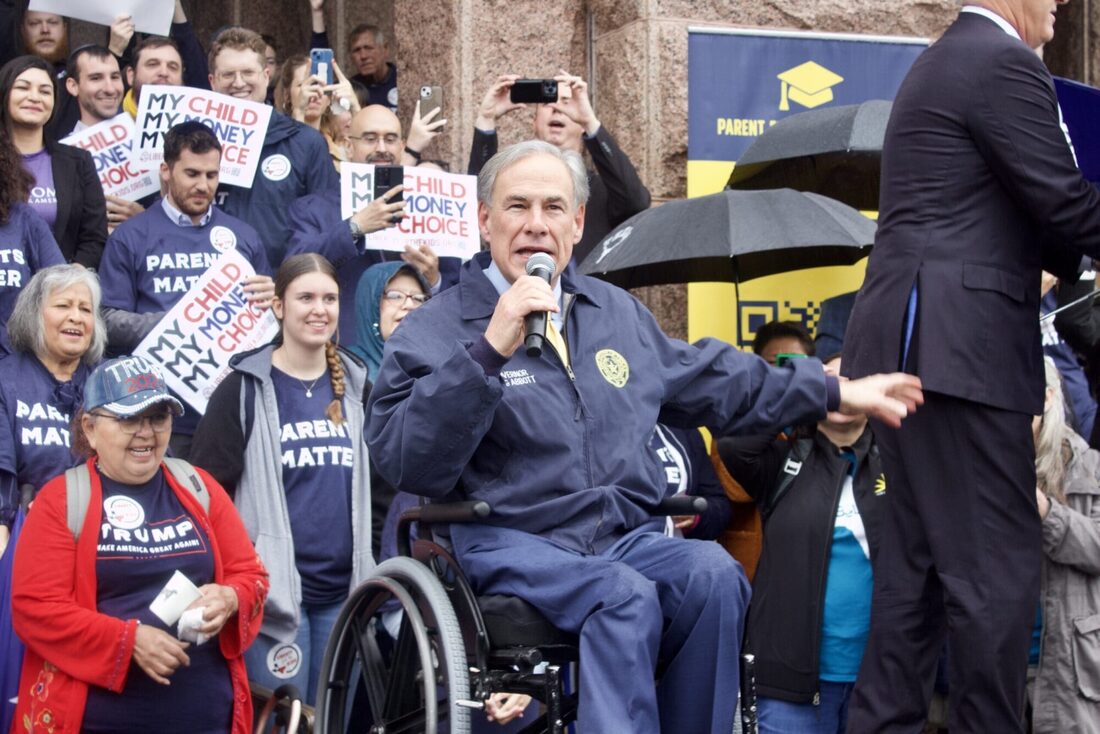 Originally published at Texas Scorecard.
Texas can pass bold school choice legislation when the next legislative session starts in January 2025. This could finally happen because of the recent election wins in the House primaries, efforts led by Gov. Greg Abbott. The election wins include pro-school choice candidates beating anti-school choice incumbents or filling seats of retiring anti-school choice members. More incumbents, including House Speaker Dade Phelan, were forced to a runoff in May. Moreover, 80 percent of Republicans voted for Proposition 11 on the primary ballot to support school choice, which matters in a dominantly red state. In the evolving educational reform landscape, universal education savings accounts (ESAs) provide the best path to empower parents to decide their children’s education. They are also a practical, fiscally responsible strategy for reimagining the future of education. At least 10 states have passed universal school choice, and more are likely to do so soon. But these states haven’t reached the pinnacle of what a competitive education system should look like. The optimal school choice approach should liberate education from the constraints of the monopoly government school system, draw upon successful market-driven solutions, and offer a simplified education finance system. The Texas Legislature essentially controls the current school finance system with funding from taxpayers through taxes collected by the state, school district, and federal governments. The inefficiency and ineffectiveness of the status quo are stark, including questionable but relevant declining test scores. This highlights a critical need for an approach that better serves students’ and families’ unique needs and aspirations. The state’s school finance system is based on many factors to the school system, but the Texas Education Agency recently reported that the average funding per student was $14,928 in the 2021-22 school year. Total funding was $80.6 billion for 5.5 million students. Of course, this is how much is spent, but the actual cost of the monopoly government school system is hidden and driven higher by politics rather than market outcomes. ESAs provide flexibility in covering many educational services, including various schooling options, tutoring, testing, and other related expenses. This empowers parents to customize their children’s education to suit individual learning styles and interests. This adaptability is vital for fostering environments where children excel academically, socially, and emotionally. Implementing a universal ESA program demands a framework that balances simplicity with accountability, ensuring the focus remains on expanding educational opportunities and improving student outcomes. While many current ESA programs run alongside the government school system, this doesn’t provide the most competitive framework. Running them in tandem, whereby the funding remains the same or even increases for government schools while creating a new system to fund ESAs, is costly and lacks the incentives for optimal outcomes. Instead, we should pursue a simplified education finance approach that maximizes competition, reduces costs, and lowers taxes by funding students, instead of a system. A bold proposal would provide parents with an ESA of $10,000 per child for the school year but paid monthly or the preferred frequency to choose any approved schooling, including government, private, charter, home, co-op, tutoring, or other types of schooling. With about 6.3 million school-age children in Texas, the annual total expenditure would be $63 billion, or $17.6 billion less than what’s being spent today on government schools. Parents could receive an ESA of as much as $12,800 per student to keep the same expenditures as today. However, given the bloated bureaucracy and misguided direction of government schools, the $10,000 amount would help force efficiencies while reducing taxpayers’ costs and incentivizing new education providers. The lower cost of $17.6 billion would provide an opportunity for substantial school property tax relief. Combining ESAs and property tax relief would further accentuate the proposal’s appeal, addressing the lack of school choice and burdensome property taxes. The bold approach eliminates most, if not all, of the current antiquated government school finance system with one that gives parents a way to meet their children’s unique learning needs best. It would help alleviate the hardship for many families that can choose alternatives for financial reasons, pay lower property taxes, or have money remaining to invest in their children’s quality of life and educational pursuits. As states across the nation begin to recognize the transformative potential of this bold universal school choice approach, the momentum is undeniable. This trend underscores a growing consensus on the need for educational systems that prioritize choice, flexibility, and parental empowerment. By breaking free from the monopoly government school finance system and embracing a bold ESA finance approach that empowers parents, we can pave the way for a future where every child can achieve their full potential.  Originally published at AIER.
Taxing unrealized capital gains on property, stocks, and other assets is not just a bad idea, it’s an economic fallacy that undermines economic growth and personal liberty. Unfortunately, President Biden’s $7.3 trillion budget proposes such a federal tax. Vermont and ten other states have made similar moves. This tax should be rejected, as it is fundamentally unjust, likely unconstitutional, and would hinder prosperity and individual freedom. A tax on unrealized capital gains means that individuals are penalized for owning appreciating assets, regardless of whether they have realized any actual income from selling them. If you purchased a stock for $100 this year, for example, and it increased to $110 next year, you would pay the assigned tax rate on the $10 capital gain. You didn’t sell the asset, so you don’t realize the $10 appreciation, but must pay the tax regardless. The following year, it dropped to $100, so there was a loss of $10. Would you be able to deduct that loss from your tax liability? The devil is in the details of the approach to this tax, but the devil is also in the tax itself. Adam Michel of Cato Institute explained two types of unrealized taxes in President Biden’s latest budget:
Taxing unrealized capital gains contradicts the basic principles of fairness and property rights essential for a free and prosperous society. Taxation, if we’re going to have it on income, should be based on actual income earned, not on paper gains that may never materialize. Moreover, taxing unrealized gains hurts economic activity by discouraging investment and capital formation, the lifeblood of a dynamic economy. When individuals know their unrealized gains will be taxed, they have less incentive to invest in productive assets such as stocks, real estate, or businesses. This leads to a misallocation of resources and slower economic growth. Additionally, this tax reduces the capital available for entrepreneurship and innovation. Start-ups and small businesses often rely on investment from individuals willing to take risks in the hope of eventually earning a return on their investment. By taxing unrealized capital gains, we discourage risk-taking and stifle innovation, essential elements for improving productivity and raising living standards. The tax undermines personal liberty by infringing on individuals’ property rights and financial privacy. It gives the government unprecedented control over people’s assets and creates a powerful disincentive for individuals to save and invest. This is particularly troublesome in an era of increasing government surveillance and intrusion into private affairs. Proponents of taxing unrealized capital gains argue that it is a way to address income inequality and raise revenue for social programs. This argument can’t withstand scrutiny. This tax does little to address the root causes of income inequality, such as government failures in fiscal and monetary policies. Instead, this new tax would merely redistribute wealth from productive individuals to the government, thereby further misallocating hard-earned money. Furthermore, the tax revenue raised from this tax will be far less than proponents anticipate, as individuals will work less, invest less, and find ways to avoid such taxes through legal paths. This would result in less economic prosperity and a resulting decline in tax collections. From an economic and moral perspective, taxing unrealized capital gains from property, stocks, and other assets is a bad idea. It undermines economic growth, stifles innovation, and infringes on personal liberty. Instead of resorting to the misguided policies of the Biden administration and some states, we should remove barriers created by the government. These include reducing spending, taxes, and regulations. We should also impose fiscal and monetary rules. Achieving these goals and ending the bad idea of a new tax on unrealized capital gains will encourage investment, entrepreneurship, and economic opportunity for all. Only then can we truly unleash the potential of a free and prosperous society. Could Colorado become one of the seven states with no income tax? Vance Ginn, former White House Office of Management and Budget, believes the state is on the #Path2Zero.
 Originally published at James Madison Institute. Florida is an economic leader because it has produced pro-growth policies of lower government spending, taxes, and regulations for years. This strong institutional framework must continue. A new report, “Reducing the Burden of Sales Taxes in Florida,” authored by The James Madison Institute (JMI) Senior Vice President Sal Nuzzo and JMI Senior Fellow Vance Ginn, Ph.D., outlines recommendations for ways in which Florida lawmakers can reduce the government burden on citizens and businesses. “Florida continues to be the best place to start and grow a business. That requires us to continually examine ways to make it more attractive as states become more and more competitive. One way our policymakers and governor can do this is by addressing the sales tax allowance, which currently places us at a competitive disadvantage when looking at other states, especially within our region. By making this allowance more reflective of how much compliance truly costs, we can ensure that the principles of limited government and economic liberty advance.” — Sal Nuzzo, Senior Vice President, The James Madison Institute “Florida has been a key model for the country with a sound approach to conservative fiscal policy. This includes the commitment to a conservative state budget, no personal income tax, minimal corporate welfare, and sensible regulation. To retain the title of “Free State of Florida” and provide more opportunities that let people prosper, policymakers should continue championing policies that spend, tax, and regulate less so families and entrepreneurs can reach their full potential. Reducing the burden of collecting sales taxes on entrepreneurs by at least doubling the sales tax allowance and streamlining the collection process to reduce compliance costs will help achieve this goal while providing lower prices to families.” — Vance Ginn, Ph.D., Senior Fellow, The James Madison Institute Thank you for tuning into the FINAL Let People Prosper podcast episode 76 of 2023! Today, I have a brief but informative podcast for you, recapping the highlights of the economy and my business, Ginn Economic Consulting, LLC.
As a Christmas gift, I am giving away a complimentary subscription to the paid version of my newsletter and a copy of Lexi Hudson’s fantastic book, “The Soul of Civility: Timeless Principles to Heal Society and Ourselves.” To enter this giveaway, simply fill out the information at the link and rate my podcast on either Apple Podcasts or Spotify. Is there anyone whom you would like for me to interview in 2024? Leave them in the comments. Today, I cover:
 The rise of several underdog states and the fall of previous favorites tells the story of the Tax Foundation’s new 2024 State Business Tax Climate report. The findings support how less government contributes to more flourishing, while heavy-handed taxes hinder prosperity.
The scores for the 50 states in the report declined by 0.19 points from the prior report, indicating a less overall competitive business tax climate nationwide. Considering that half of all states have cut taxes over the past three years, and an increasing number are moving to flax taxes, pressure is building on states to seek tax cuts or risk getting left behind. An inspiring success story is Iowa, which has emerged as a beacon of pro-growth tax reform. Iowa reduced its top marginalindividual income tax rate from 8.53 to 6.0 percent. By consolidating its previous nine tax brackets into four, the newer, more streamlined tax system is less burdensome for Iowans. Another improvement in Iowa’s reforms was reducing the marriage penalty. The state removed a longstanding tax burden by doubling the bracket amounts for married couples filing jointly. The state also shifted its previously three-bracket corporate income tax structure into just two brackets, which caused the top rate to drop by 1.4 percentage points. As a result of these changes, Iowa’s ranking improved from 38th to 33rd in just one year. While there’s room for improvement, the state is on a better path. Considering the conservative budgeting by Governor Reynolds and the legislature, and the transition to a flat 3.9 percent income tax rate by 2026 and a flat corporate income tax rate of 5.5 percent, the state could soon be on its way to 15th place. Massachusetts, on the other hand, experienced the sharpest decline of all the states, plummeting 12 places down to 46th. This regression in business tax competitiveness can be largely attributed to a new state constitutional amendment. It transitioned Massachusetts from a single-rate to a graduated-rate income tax system with a new 4 percent surtax for a top marginal tax rate of 9 percent for incomes over $1 million. This progressive policy not only represents a departure from the trend of rate reductions and bracket consolidation in other states as part of the flat tax revolution, but also introduces a significant marriage penalty. While implementing a new payroll tax further contributed to Massachusetts’s decline in tax competitiveness, the state’s individual tax component ranking fell from 11th to 44th. Unfortunately, this fall was foretold by the vast number of people fleeing the state, many of whom were no doubt searching for a more tax-friendly place of residence. After all, people vote with their feet. While Massachusetts experienced a sharp fall, Mississippi and Idaho emerged as rising stars in the world of tax reform. Mississippi’s ranking jumped from 27th to 20th thanks to three major shifts. It became the second state to implement permanent full expensing for select investment in machinery and equipment, passed a flat personal income tax, and will soon phase out its franchise tax. These forward-thinking policy changes encourage investment and economic growth, positioning Mississippi as a more competitive business destination. Likewise, Oklahoma has also made significant strides in tax reform. In addition to eliminating its marriage penalty, the state reduced its split roll ratio in property taxation and withdrew its capital stock tax. These actions propelled its property tax component ranking to substantially improve from 30th to 15th. As a result of these reforms, Oklahoma’s overall ranking has risen significantly, now at 19th. And while Governor Stitt’s recent special session was unsuccessful in making bigger strides for tax cuts, the state looks poised to do so soon, thereby improving its competitiveness. On a similar path, Idaho made a noteworthy move by transitioning from four brackets to a flat individual income tax at 5.8 percent. Additionally, the state cut its corporate income tax rate to 5.8 percent, further enhancing its tax competitiveness. These reforms boosted its individual tax component rank by two places, now at 17th. The findings from the Tax Foundation’s report underscore a fundamental economic truth: Free markets do not discriminate. They thrive where they are permitted to flourish, and that starts with sustainable budgeting and sound tax policy. States like Iowa, Oklahoma, Mississippi, and Idaho, which prioritize tax cuts and financial freedom, are poised to rise in the rankings and could quickly become some of the more sought-after states. As they continue to reduce tax burdens, they create environments where individuals and businesses can retain more of their earnings, which invites innovation, improves the quality of life, and encourages moving to those states. Meanwhile, states like Massachusetts and New Jersey, which ranks 50th in the report, choose high spending and taxes that will contribute to continued out-migration as individuals and businesses seek refuge in states prioritizing economic freedom. The message is unmistakable. Free markets work, and policymakers should heed the lessons from these tax climate rankings. Originally published at AIER.  The Texas Legislature just found out it has a huge opportunity to correct its profligate spending failures made earlier this year. But instead, they’re gearing up to spend more at the expense of strapped taxpayers. This would be a fatal error for the Lone Star State.
Texas Comptroller Glenn Hegar recently released the Comptroller's Revenue Estimate (CRE). This report acts like a financial checkup to confirm sufficient tax revenue available to cover expenditures based on the state’s balanced budget amendment. The current two-year tax revenue for 2024-25 was updated higher to $194.6 billion available for general spending, an increase of 24.8% from the previous budget. This certified revenue estimate exceeds the $176.3 billion appropriated by the 88th Legislature for general purposes, resulting in a projected surplus of $18.3 billion. This large amount is from a more vibrant economy than previously estimated and could go a long way to putting school property taxes on a path to elimination. Yet the Texas Legislature’s recent out-of-control spending habits indicate taxpayers probably won’t get more property tax relief than the minimal amount passed this year. The state wants to increase spending on a government school system in the current third special session rather than on students to have universal school choice. And spending could go up by more than $13 billion outside of the expenditure limit if voters approve most of the 14 constitutional amendments on the state ballot this year. Add it all up, and it’s no wonder that Texans find living in many places across the state unaffordable. While Texas has witnessed major economic achievements this year, such as noteworthy records for labor force participation and job creation, the 88th Legislature's actions raise serious concerns about the future. This year, the Lone Star State passed its largest spending increase, largest corporate welfare, and just the second-largest property tax cut in state history, which the latter will underwhelm homeowners when they get their bills. This could be a major problem for Republicans who have touted this as the “largest property tax cut in the world” or the “largest property tax cut in Texas history.” While Texans grapple with an affordability crisis, spending the state surplus and voters approving the proposed ballot items, except propositions 3 (prohibit wealth taxes) and 12 (abolish Galveston County treasurer’s office), would add insult to injury. Rather than squandering the surplus, the Texas Legislature should prioritize strengthening the Texas Model by: 1. Spending less at the state and local levels, strengthen the state’s spending limit with the rate of population growth plus inflation covering all state funds, and have that spending limit also cover local government spending similar to Colorado’s Taxpayer’s Bill of Rights. 2. Taxing less by putting local property taxes on a path to elimination using surpluses to reduce school district M&O property tax rates until they are zero. Local governments should leverage their surpluses to reduce their property tax rates until they are zero. 3. Regulating less by removing barriers to work, removing occupational licensing restrictions, reforming safety nets, and passing universal school choice. Strengthening the Texas Model isn't just about fiscal responsibility; it's about securing a thriving future for generations to come. Texas, with its unique spirit and determination, can continue to lead the way, fostering an environment where free-market capitalism thrives and individuals prosper. The surplus, instead of being frittered away on needless pursuits, should be a catalyst for transformation that redefines the Lone Star State's destiny, safeguards liberty, and sows the seeds of enduring prosperity. Originally published at The Center Square. I hope you enjoy the fantastic 67th Let People Prosper Show episode with TX State Rep. Brian Harrison! Please subscribe to my newsletter if you haven’t already, and subscribe to my podcast wherever you get yours. I would appreciate it if you would also rate and review my podcast! Brian (bio) and I discuss:
 While the latest “strong” US jobs report and “cooling” CPI inflation have been touted as promising, a closer look reveals more complexity, and many American families continue to bear the brunt of DC’s failures over the last three-plus years.
The payroll survey’s net gain of 336,000 non-farm jobs is a popular headline, as the figure nearly doubled expectations. But the household survey, a second crucial report by the US Bureau of Labor Statistics, shows that only 84,000 jobs were added in September. Meanwhile, the unemployment rate stayed at 3.8 percent, which would be much higher if more people were looking for work. Let’s consider the labor force participation rate of 62.8 percent to double-check the headlines. If this rate were 63.3 percent, as it was in February 2020, there would be 1.4 million more people in the labor force. If they are all unemployed, today’s unemployment rate would be nearly 5 percent, which is substantially higher than the touted 3.8 percent rate. There have also been substantial revisions to the non-farm jobs report in recent months because of volatile data used for seasonal adjustments since the shutdowns, which makes much of it “garbage in, garbage out.” There were, for example, an additional 119,000 jobs added over just July and August than what was initially reported, giving us reason for pause with all of these reports. In short, this volatility in the job market data makes it challenging to discern actual trends, especially when Americans continue to be concerned about the economy. On top of a fickle job market, the latest consumer price index (CPI) sits at 3.7 percent over the past year, while the core inflation, which excludes food and energy, is 4.1 percent. This core inflation rate is double the Federal Reserve’s average inflation rate target and doesn’t show any signs of reverting to 2 percent any time soon. This problem was created by the Fed’s bloated balance sheet, which results from its willingness to help finance the federal budget deficits caused by excessive government spending. Until Congress reins in government spending and money printing, inflation will strain household budgets. Also, real (inflation-adjusted) average weekly earnings dropped by 0.2 percent over the past year, and the average family’s real income has suffered a significant blow, with a decline of more than $7,000 since the start of 2021. These financial setbacks are not coincidental. They are the direct result of the progressive policies of the Biden Administration, the Federal Reserve’s bloated balance sheet, and Congress’s habit of excessive spending. If we want to understand the true state of our economy, we should pay more attention to the Fed’s balance sheet, which remains a crucial indicator of inflationary pressures. This is why I was never on team “transitory inflation.” Even a relatively superficial understanding of the work of Milton Friedman, Friedrich Hayek, and John Taylor has indicated from the start that we would face persistent inflation. Sure, supply-side factors contributed to higher prices in some markets, as did supply chain bottlenecks. But those are short-term fluctuations that don’t tell the entire story of reduced purchasing power for everyone over a longer period, which is a story of failed public policy on top of the failed shutdowns during the pandemic. The explanation is pretty straightforward. There was a sudden halt in the economy due to pandemic shutdowns that distorted many exchanges throughout the marketplace. The federal government then sent out redistributed money to individuals and employers so they wouldn’t have to fret too much during a stressful time. This propped up many Americans, creating any number of zombie firms, zombie workers, and a debt-fueled zombie economy. But this alone wouldn’t explain the inflation, as increased government spending doesn’t stimulate anything other than more government and some specific markets. Next, the Fed more than doubled its balance sheet, increasing its assets from $4 trillion to $9 trillion. This doesn’t lead to long-term economic growth, but it does contribute to many market distortions and inflation across the economy. Much of this money stays in the hands of the banks, mortgage companies, and others at the upper part of the income spectrum. Only then does some of it spread further, in a process known as the Cantillon effect. The problem is not only a propped-up economy with multiple asset bubbles, but reduced purchasing power that punishes lower-income families the most. Few, if any, of the positives from more money in circulation goes to these families. Instead, they have seen whatever savings they had dwindle. To achieve a more stable and prosperous economic future, we must strike a balance between sound fiscal and monetary policies and curb excessive government spending and money printing. This will only begin to happen when we have rules that control discretionary policies by the administration, Congress, and the Fed. While headline jobs and inflation data might suggest a strong economic recovery, digging just a little deeper into the data shows a weak economy with major challenges. It’s time for policymakers to take a hard look at the factors contributing to these economic woes and adopt prudent policies that address the root causes of stagflation. Originally published by AIER. Read the full paper here. Here's the original post by the Pelican Institute. Pelican Institute reform plan would flatten personal and corporate taxes, boost jobs in first year. Baton Rouge — As candidates for Louisiana governor debate the future of the state, a new poll shows Louisiana voters strongly support phasing out the state’s income tax while ushering in fiscal responsibility. Today, the Pelican Institute has released a new tax reform plan that would do just that—transform the state, make it more competitive, pave the way for more and better jobs, and launch Louisiana’s comeback. By a wide margin, 58% of Louisiana voters support phasing out the state income tax (only 20% oppose), and 66% want leaders to prioritize responsible budgeting and limiting the growth of state spending to bring fiscal stability to state government (only 9% oppose). Voters also strongly back education freedom; 62% support giving Louisiana parents the ability to use state funds to select the school of their choice for their child’s education (only 25% oppose). The poll, which was conducted by Cor Strategies in partnership with the Pelican Institute, can be seen here. In Louisiana’s Comeback: A Tax Reform for Our Brighter Future, the Pelican Institute identifies the state’s significant tax problems and proposes a path to set the state in a brighter direction, including flattening the personal and corporate income taxes to 3.5% rates, reducing the number of tax preferences, eliminating the corporate franchise tax and the inventory tax, and reforming the budget to limit the growth of spending, among other changes. “If we are to write Louisiana’s comeback story, we first have to get our fiscal house in order and fix our broken tax code that has, for far too long, landed Louisiana at the bottom of every good list and the top of every bad list,” said Daniel Erspamer, Chief Executive Officer of the Pelican Institute. “Louisiana families are suffering, and too many of our best and brightest are leaving the state to find opportunity elsewhere. It’s time to embrace a bold vision for tax reform proven to bring jobs and opportunity – not to mention our kids and grandkids – back to our state.” Louisiana suffers under a tax system that is brutally punishing for families and businesses. It is painfully progressive, thereby increasing tax rates as more income is earned—and that disincentivizes greater earnings, reduces productivity, and slows economic growth. Meanwhile, tax preferences create exemptions and deductions that make compliance costly, pick winners and losers, and narrow the tax base. That, in turn, requires an even higher tax rate to collect needed revenue for funding limited government. On top of that, Louisiana’s taxes on businesses are particularly burdensome, including a triple taxation on profit, investment, and inventory, that together stifle economic growth. The Pelican Institute’s tax plan solves these problems with a proposal that will kickstart the economy into immediate growth and increase the number of available jobs in the state in the first year. The plan is the latest part of the Pelican Institute’s Comeback Agenda released in March of this year, which lays out a series of policies critical to the state’s future, including tax and budget reform, guaranteeing universal education freedom, enhancing public safety, and reducing regulatory barriers to work. A two-page guide to the reform can be read below and a one-pager below that.  A recent report from the Tax Justice Network (TJN) boldly asserts that “countries will lose $4.7 trillion over the next 10 years…[and] countries around the world collectively spent $4.66 trillion on public health in a single year” due to tax havens. In light of this seemingly shocking discovery, many groups are now campaigning for global tax reform so that nations will avoid “losing out” on tax revenue.
The new idea of the “UN tax convention and to create a global tax body under UN auspices” would do the opposite of creating better economic outcomes. According to the report, which compiles data from 47 countries, multinational corporations legally avoid paying the highest taxes, mainly by moving to so-called “tax havens.” Tax havens include jurisdictions offering low corporate tax rates, alluring multinational corporations and affluent individuals to seek tax relief by conducting their financial activities there. A key player in this process is profit shifting, where companies redirect their profits to low-tax jurisdictions, despite earning most of their revenue in high-tax regions. Small countries like the Cayman Islands, with their corporate tax rate of only 6%, are one of these havens, but there are also more prominent countries like Switzerland and Hong Kong that are favorable homes for large corporations, both having rates under 20%. It’s perfectly legal for a company to move its headquarters and finances to other countries, but these tax havens can pose a threat when many governments depend on taxes to finance government spending. Rather than risk losing these resources, countries are clamoring for centralized taxation with higher tax rates to level the playing field. But there’s a better way. While these countries are pointing to tax havens to try and place blame for lost tax revenues, there are three fingers pointing back at them. Instead of centralizing a global tax and empowering politicians and bureaucrats, countries with high corporate taxes, like the U.S., with a corporate tax rate of 21%, should consider domestic tax reforms that prioritize lowering corporate taxes and limiting government spending. Reduced corporate tax rates, like those in the 2017 Trump tax cuts, can enhance a country’s competitiveness and appeal to businesses instead of driving them to move their money to tax havens. This was the result of those tax cuts as many businesses started moving back to the U.S. or started repatriating their money here. Simultaneously, keeping government spending in check with responsible budgeting prevents escalating the government’s overall burden, reducing the “need” for higher taxes. While corporate taxes typically pass along the burden to consumers through higher prices, fewer jobs, and lower wages, consumption-based taxes such as final sales and use taxes (not value-added taxes) are less burdensome and more equitable. And these taxes better match economic fluctuations and taxpayers’ ability to pay for spending, which is why more countries (and states) should be moving to them. Fewer burdensome taxes support more economic growth, resulting in more tax revenue, which many politicians desire. By supporting growth instead of raising taxes and hoping that converts to growth (it won’t), spending can be better balanced, reducing deficits, which is just future taxes. While the Tax Justice Network’s findings are interesting, they hardly point to the need for global tax reforms because these tax havens are legal ways to avoid paying higher taxes. Instead, the U.S. and elsewhere should reform their tax system if they hope to foster competition and provide more paths for human flourishing. Originally published at Econlib.  Texas Governor Greg Abbott (R) recently signed into law the tax relief compromise by the Legislature’s second special session. This relief is historic with the country’s largest tax cut and the largest net tax cut in Texas history.
But it falls short of what Texans were promised of the largest property tax cut in the state’s history, as it’s instead the state’s second largest property tax cut because of the largest spending increase in Texas history. Rather than providing substantial relief and simplifying the property tax system, the package presents a burdensome approach that could hinder the state's progress. By overspending and adopting a convoluted tax relief strategy, Texas risks falling behind states rather than leading the way in addressing real property tax concerns. The deal provides $12.7 billion in new property tax relief out of the nearly $33 billion surplus as the Legislature increased the upcoming 2024-25 biennial budget by more than 30% in state funds. This is the largest increase in Texas history and well above the the key rate of population growth plus inflation of 16% over the last two years. The major target for property tax relief was reducing school district maintenance and operations (M&O) property taxes. These property taxes are essentially a statewide property tax, which is prohibited by the state’s constitution, as they are partially determined by the state’s school finance system that includes redistribution of property taxes from school districts with high-valued property to districts with lower-valued property. Of the nearly $33 billion in state surplus funds and tens of billions more in new revenue available, the state allocated just $7.1 billion for a modest 10.7-cent reduction per $100 valuation in those property tax rates, called “compression,” which provides long-lasting relief and benefits everyone. The other $5.6 billion is for raising the homestead exemption by $60,000 to $100,000 for the appraised value of primary residences to determine how much is paid for school district property taxes. But this will be short-lived as valuations rise quickly and has failed to provide long-lasting relief the last three times it’s been tried in Texas since 1997 while benefitting only only homeowners. The $12.7 billion over the next two years will hardly alleviate the burden of property taxes on Texans and is a far cry from eliminating them altogether as Gov. Abbot initially set out to do. The package also includes a pilot project of an appraisal cap on non-homestead property at 20% per year for three years. This property doesn’t have a cap on it today so this will benefit some but will mean that local governments will just ratchet up property tax rates to bring in the tax revenue they desire to grow spending. There will also now be three elected officials added to county appraisal boards. Texans are left with this compromise package that unnecessarily complicates the tax system and obstructs efforts to eliminate school M&O property taxes, enabling the government to pick winners and losers. In this case, renters would undoubtedly be among the losers, and they are nearly 40% of households across the state. A more robust approach is necessary soon to achieve significant, long-lasting property tax relief for Texans. The best path being discussed is to buy down school district M&O property tax rates with surplus funds starting with limiting government spending, which was lacking this session after years of an improving budget picture. Ways to improve this overall package would have been by institutionalizing the buy-down plan and imposing spending limits on local governments. The final part of the package is $600 million to raise the exemption of gross receipts to pay franchise taxes from $1 million to $2.47 million, which is important but doesn’t help reduce property taxes and is less effective than cutting the franchise tax rates until they’re zero. This brings the total amount of new tax relief to $13.3 billion. This amount is lower than the $14.2 billion that the Legislature provided to buy down school property taxes in 2008-09, which would be about $21 billion to have the same purchasing power today. And even if you include the state maintaining its property tax rate reduction in 2019 of $5.3 billion in this year’s budget for a total of about $18.6 billion, it would not equal $21 billion. But that 2008-09 relief was done by raising bad taxes of the franchise tax, sales tax on motor vehicles, and cigarette tax which this time no taxes are raised as the taxpayer funds come from surplus money. So, this 2023 tax relief package can be called the “largest net tax cut in Texas history” but not the “largest property tax cut,” and is the largest tax cut in the country. But Texans could have had more relief if the state hadn’t spent so much. Eliminating school property taxes is a crucial next step for Texans to truly own their homes instead of renting from the government forever. And this will be achieved faster when politicians stop spending so much. So while this historic relief is much appreciated, there’s much more to do next session for Texans to stop renting and start owning. Originally published at Real Clear Policy.  (The Center Square) – The property tax relief package passed by the state Legislature is the second largest in Texas history, economist Vance Ginn, president of Austin-based Ginn Economic Consulting, says.
While at the Texas Public Policy Foundation, Ginn helped devise a plan to eliminate one of multiple property taxes homeowners pay: the school maintenance and operations (M&O) tax. Eliminating this tax over time was part of Gov. Greg Abbott’s call for the first and second special legislative sessions. Ginn, who sat down with The Center Square to explain differing property tax relief approaches, was also integral to implementing federal tax reform efforts when he worked at the White House’s Office of Management and Budget under the Trump administration. After the legislature passed an $18 billion property tax relief package Thursday, House Speaker Dade Phelan said it was “the largest cut in Texas history.” Lt. Gov. Dan Patrick said it was “the largest property tax relief package in Texas history, and likely the world.” Abbott, when running for reelection for his third term, vowed to return half of the state’s record $33 billion surplus to taxpayers. On Wednesday, he said the package allocated “at least $13.5 billion from our historic budget surplus to provide substantial relief to property taxpayers across Texas.” With additional money from the budget, he said they were delivering “over $18 billion in property tax cuts.” According to Ginn’s analysis, the package includes $12.7 billion in new relief and $5.3 billion from the earlier-approved state budget. Neither $13.5 billion nor $12.7 billion is half of the surplus, he points out. The combined $18 billion in property tax cuts, Ginn also points out, isn’t the largest property tax cut in state history. That occurred under Gov. Rick Perry in the 2008-2009 legislative session when the legislature passed $14.2 billion in property tax relief, he said. In order to surpass that, adjusting for inflation, “for us to have the same purchasing power of those dollars back then it would need to be about $21 billion,” he said. “This isn't the largest tax cut in history. It's substantial, it's historic, probably the second most ever.” But more problematic, he says, is the Republican-led legislature spent more money than ever before. “This session was the largest spending increase in Texas history of more than 20%,” he said. “If you look at all funds, and more than 30% if you look at state funds, the state's portion is up by a massive 30%. More than $50 billion being spent; that’s more than ever before. “If you spend too much, you can't provide as much in tax relief. That's just dollars coming from the taxpayers.” The $33 billion surplus means the state over collected taxes, he added. “That should be returned to the taxpayer. And the best way to do that,” through property tax reduction, “is through compression.” “The research that I've done on this in the past is that's the only way you can get to zero. If we really want to eliminate property taxes, which is what Governor Greg Abbott said he wants to do, you can't do it by raising the homestead exemption. You could raise the homestead exemption to $1 million, $2 million, $3 million but you're always going to have property values that are above that. So that can't get you to zero.” “Appraisal caps don't do that either,” he said, because they just slow growth, referring to the House plan, which was included in the bill. “Appraisal caps don't reduce property taxes. The only way to get to $0 per a $100 valuation, meaning a 0% tax rate, is by compression, lowering property tax rates until they get to zero. If you want to talk about limiting the growth of property taxes or a small relief, then you can talk about appraisal caps or homestead exemptions. But if you want elimination, and actually reduce them over time, the only way, the gold standard, is compression.” Ginn explained how compression works. "Rght now, when people pay property taxes to the school districts, the districts are funded at a set amount. The amount [that taxpayers overpay] that goes over the set amount, known as recapture, spills over and goes to Austin. When we talk about compression, what we're saying is we're wanting to reduce the recapture amount by the state funding a reduction in school M&O property tax rates. “You do this by using state dollars collected from taxpayers, mostly sales taxes, but also franchise taxes. The school districts still receive the same amount of money because state law requires them to be fully funded. The difference is how much [recapture money] goes to Austin or not.” Compression going to zero would eliminate recapture altogether, he explains. Recapture is one reason why “the school property tax is essentially a statewide property tax,” he said. While the M&O tax is “determined by the school finance formulas that are set by the Texas legislature, “It's local in name only. That's why the focus has been to eliminate it at the state level. Use record levels of sales taxes and surplus dollars to reduce, compress the school district property tax until it goes all the way to zero.” Original post at Washington Examiner from The Center Square.  An Overview
The good news is that state officials in Texas have been debating how to provide one of the largest tax cuts in the state’s history and were even talking about eliminating school maintenance and operations (M&O) property taxes. But that good news withered away in the second special session of the 88th Texas Legislature, as the amount looks to be only about $12.7 billion in new relief (an additional $5.3 billion to maintain past relief was passed in HB 1 budget) of the at least $33 billion surplus. And given that the largest property tax cut was $14.2 billion for 2008-09, the state would need to provide $21 billion in new relief this time for it to be the largest tax cut in Texas history, so Texans could have the same purchasing power of relief as they had then. While there has been a lot of debate on how the state should provide property tax relief of school district maintenance and operations (M&O) property taxes, which comprise more than 40% of total property taxes collected by local governments across the state, the best way to provide the most relief to everyone is through compression. This is simply using state dollars—mostly through sales taxes—to buy down school district M&O property tax rates that the state mostly controls with its school finance formulas. Instead, the compromise between the House and Senate, which Governor Abbott looks poised to sign, is a watered-down approach that provides too little in relief—just $12.7 billion in new relief in SB 2 (88(2))—because they chose to spend too much. And there is too little in compression with just $7 billion for 10.7 cents per $100 valuation in reduction for school M&O property taxes. The rest is a combination of raising the homestead exemption for school districts by $60,000 to $100,000, limiting non-homestead appraisal growth to 20% for three years, and requiring three directors on appraisal district boards to be elected with counties that have a population of 75,000 or more. The next part of the package is SB 3 (88(2)), raising the franchise tax exemption for gross revenue to $2.45 million from $1 million. The final piece is HJR 2 (88(2)), which puts this package (except the compression) on the November 7, 2023, ballot for voters to consider approving. While it is good that there is so much going to tax relief, this package will make the tax system more complicated, make it more difficult to eliminate school M&O property taxes, contribute to higher school M&O property tax rates, and shift the burden around as homesteads and small businesses are chosen as the winners while renters and other employers are losers. The government should not be in the business of socially engineering people’s lives through the tax code by picking winners and losers, and this is exactly what this package does. Paths to Eliminating Property Taxes I have long researched and published on eliminating property taxes in Texas. There are different ways to do it, but the one discussed most recently by Texans for Fiscal Responsibility and Governor Abbott was the buy-down of school M&O property taxes until they’re eliminated, something I supported in a paper I co-authored in 2018. The plan has been through multiple iterations. My July 2021 co-authored paper looked at this buy-down approach of using 90% of state surplus dollars above a stricter spending limit of population growth plus inflation to compress school M&O property tax rates until they are zero within about a decade; the other approach explored in this paper was of tax reform that would broaden the sales tax base to eliminate those taxes immediately, without raising the rate, based on a dynamic economic model. Both of these were built on a strong spending limit, given spending is the ultimate burden of government on taxpayers. The latest was a December 2022 co-authored paper where we address the affordability crisis in Texas and how the buy-down plan would help with this while providing more economic growth. I also wrote a 2023 paper updating this based on how quickly this could be done if a frozen budget with zero growth was used to provide more surplus funding to eliminate these property taxes. I also wrote another 2023 paper noting how there is no need to be fearful about a recession or reduced revenue as there would be the need for spending restraint or cuts, plenty of money in the rainy day fund, or excess reserves held by school districts to address any shortfall to maintain the relief and fund public education. Adding to this research were two professors at Rice University who, in 2018, also studied different reforms of the buy-down approach and the sales tax expansion approach to eliminate school M&O property taxes. They found that these approaches would provide substantial benefits to the state in terms of increased economic growth and job creation. After reviewing different options for the buy-down approach, compression is best because everyone benefits, including from the dynamic effects of more growth, more jobs, and lower prices. It’s also the only way that’s being discussed today to get the school M&O property tax rate to 0%. Another approach to provide property tax relief was pushed by the Senate this year and looks to be included in the bill passed in the second special session: raising the homestead exemption from $40,000 to $100,000. But this approach will never eliminate those taxes and will push the burden of funding spending to everyone else, making the system less equitable while quickly evaporating any relief from appraisal growth and making the path to elimination harder because rates will rise from it when school spending increases. Given the different approaches discussed this year by the House and governor and then the Senate and lieutenant governor, I did an analysis of the median valued home in Texas of $350,000 in Austin, Houston, and Dallas. I used the tax rates for each of these locations and had the home increase in value by 10% per year, which is the maximum growth for a homestead under current law. I didn’t change anything else to provide an apples-to-apples comparison of a tax reform in 2023 to estimate what would happen over the next five years given a 1) $60,000 increase in the homestead exemption, 2) SB 1 (88(1)) with $60,000 increase in the homestead exemption and 10-cent compression (similar to tax relief package in second special session), 3) HB 1 (88(1)) with 16.2-cent compression, and 4) what would be largest tax cut in Texas history of $21 billion with a 25-cent compression. I should note that this modeling is just on a homestead, so it doesn’t account for the much more broad-based effects of the compression scenarios. Austin The following three charts are for Austin, including Austin ISD, to see what these four scenarios would look like given the assumptions above in each year. The first chart shows what would happen for total property taxes (i.e. ISD, city, county, and special purpose district property taxes) under these scenarios compared with the total tax paid of $5,945 for a $350,000 home in Austin. The results show that SB 1 and the 25-cent compression are similar; however, both of them would have only one year of lower total property taxes until 2025, when the amount paid would exceed that of 2023. The second chart shows similar results as SB 1 and the 25-cent compression have the greatest effects on the 2023 ISD M&O property taxes of $3,089. However, HB1 also provides relief until 2028, when the amount paid would exceed that of 2023. But, more importantly, given these are only homesteads and don’t account for families who pay rent or own a business, the third chart’s example shows that HB 1 with 16.2-cent compression and the 25-cent compression cut the tax rate the most over time, as this compression in just 2024 continues to buy down the rate as values increase by 10%. 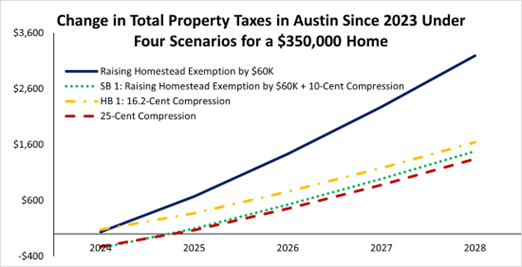 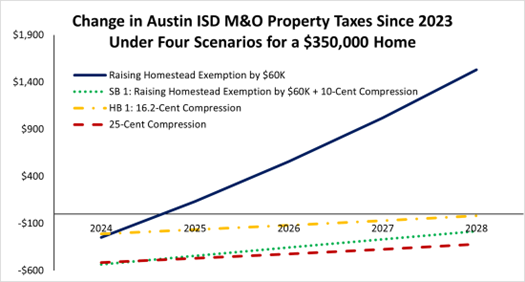 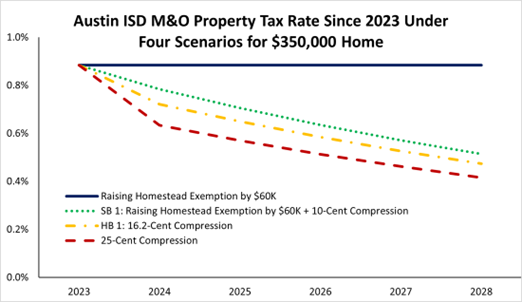 Houston The following charts are for Houston, with similar results for each of the scenarios. 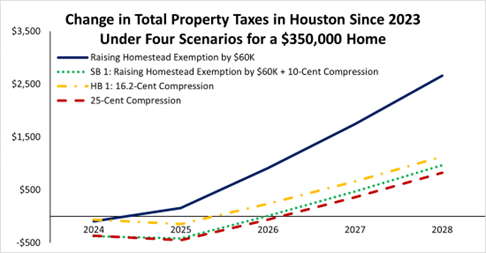 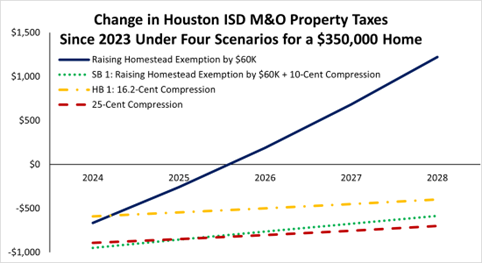 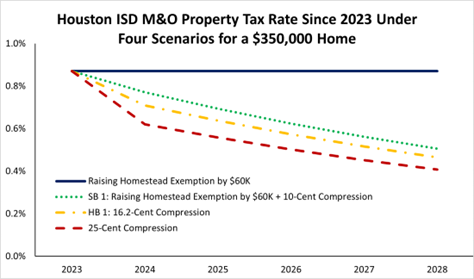 Dallas The following charts are for Dallas, with similar results. 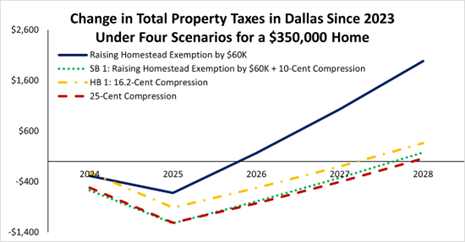 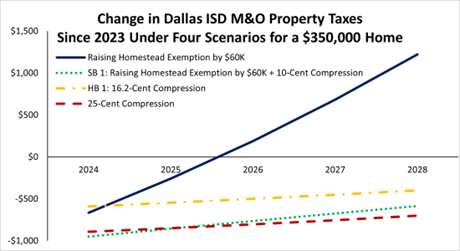 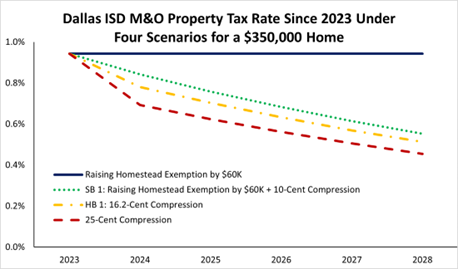 In my conversations with CBS News Texas, ABC 13 Houston, and The Texan, I recently explained how compression is the gold standard to eliminate school M&O property taxes. I also recently wrote[VG1] how the Texas Legislature had the largest spending increase in Texas history this session, thereby not providing enough in property tax relief. I argued that Governor Abbott should veto the budget or at least $8 billion of budget items and use it for compression so that Texans get record relief. But that did not happen. It should be noted that compression will help renters. The Texas comptroller’s report (see Table 33 below) finds that 26% of school property taxes is passed along to renters. Businesses submit 52% of those taxes, but people pay for them through higher prices, lower wages, fewer jobs, and higher rent. Simple supply and demand shows that the property taxes would rotate the private market supply of housing leftward, thereby raising rents and lowering the quantity supplied compared with the free market. In other words, the market does set the rents, but that market is distorted by property taxes, so removing those school taxes would help push down rents through competition. When the landlord has a vacancy and is paying lower property taxes, then she will lower the rent given lower cost to attract tenants. It may not happen overnight, but it will as that’s how competition works, and those businesses that don’t will be forced out of the market through losses. This wouldn’t just be a shift in supply of housing that would reduce rents; that would happen some when this tax is cut and certainly when it’s eventually eliminated, but that’s not the only way. 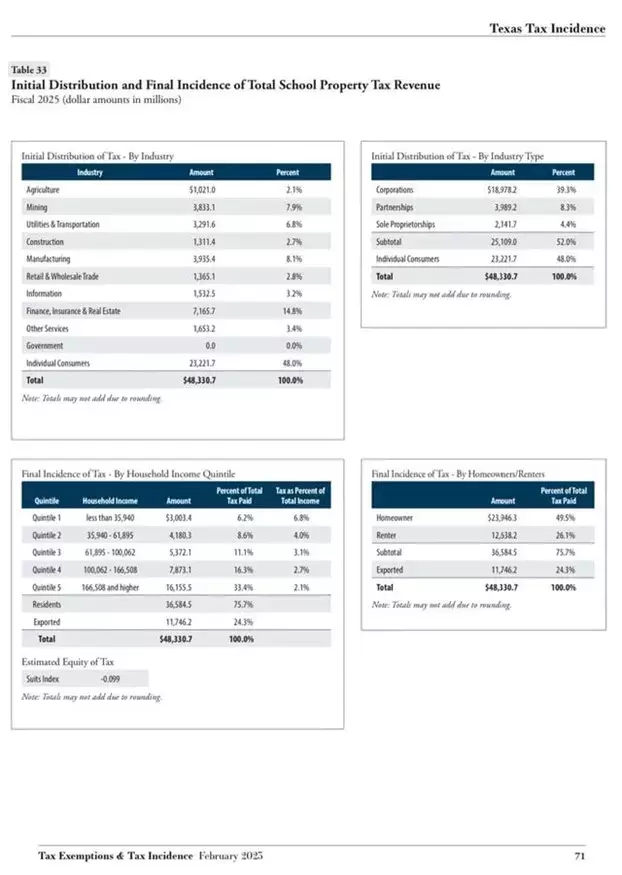 The following chart shows that there’s movement down the demand curve as the supply curve corrects to the private supply curve (S1) rather than the distorted supply curve (S2) with the ad-valorem property tax, which will lower prices and increase the quantity supplied. This is through competition that will happen as consumers will have more negotiating power and landlords will want to rent out every unit but won’t if they don’t lower their rents, as their competition will because their costs have been reduced. 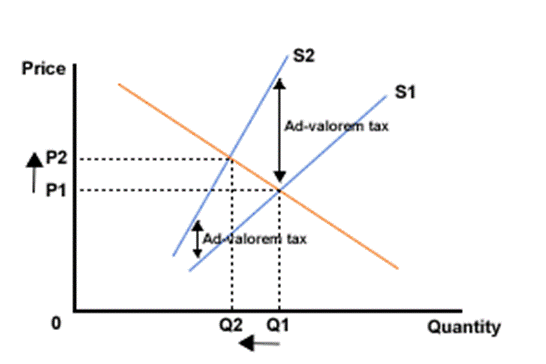 From the fact that property taxes are going down, there’s a reduction in cost by the landlords, so they have the ability to get more renters at a lower rent. As renters know, if property taxes don’t go down, they will go to another location—hence more consumer power. The consumer has much power in every market if they choose to wield it, especially when government gets out of the way. Again, it wouldn’t change rents overnight, as many are in leases, but it would over time. One of the issues contributing to the affordability crisis in Texas, especially for lower-income folks, is skyrocketing property taxes. Any relief would be most appreciated by 100% of property holders through compression. Lowering school M&O property tax rates through compression is the best path for everyone to benefit from lower taxes, more economic growth, and tax rates that would go to zero. Many groups shown in the page below have already stated their support for the buy-down plan, which was supported by the governor; the House passed much of it, though that was mostly thrown out in the final package. And they needed to add HB 16 (88(2)) by State Rep. Briscoe Cain, which would put in statute the buy-down plan to zero, along with his HB 17, which would impose spending limits on local governments.  Conclusion
At the end of the day, I’m glad Texans are talking about property tax relief. Other states have been cutting taxes, so Texas can’t sit back and be competitive with other states without spending less and cutting taxes, as corporate welfare makes the problems worse. The Legislature unfortunately passed a revamp of the expired Chapter 313 in HB 5 during the regular session. This new version, called Chapter 403, provides property tax abatements issued by school districts to mostly big businesses. Fortunately, when school district M&O property taxes are eliminated, this corporate welfare will be eliminated, too. There are so many reasons to eliminate property taxes. Texas will be an economic juggernaut! And what’s maybe the most important is that Texans will have more of their right to own property preserved instead of renting from the government forever with this immoral wealth tax known as property taxes. Raising the homestead exemption might be a part of the final deal, but we should remember that it picks winners and losers, is not sound tax policy, and has been tried three times (1997, 2015, and 2021) without substantial reductions in those taxes paid. I’m okay with broadening the sales tax base and eliminating school M&O property taxes immediately and using surplus dollars above a stricter spending limit to buy down sales taxes over time. This would also broaden the sales tax base for local governments, which should use those funds to buy down their own property taxes and limit their spending with a restrictive limit like the state’s based on population growth and inflation to use surplus dollars to buy down the rest until they are zero. But there isn’t the political will yet to take this approach, so the best way right now is the buy-down path for school property taxes by the state and local government buying down their own could happen over the next decade for the eventual elimination of all property taxes in Texas. The way to do this is by sufficiently reining in government spending, which the Legislature did not do this session—thereby wasting an unprecedented opportunity to do something big. Eliminate school property taxes first, then find a way to eliminate the rest. My preference is to limit all local government spending to the state’s spending limit based on population growth and inflation, and use 90% of their surpluses to buy down their own property taxes until they are zero. This is a path to giving Texans their God-given right to own property. Get tax relief done for Texans! Stop renting, start owning! Originally published by Texans for Fiscal Responsibility. This Week's Economy Ep. 16 | Why Final Sales Tax Is Least Burdensome with Less Government Spending7/7/2023 Thank you for watching the Let People Prosper Show, which today includes the 16th episode of "This Week's Economy,” where I briefly share insights every Friday on key economic and policy news across the country. Today, I cover: 1) National: Why America is headed down a road of less freedom and liberty due to ongoing excessive government spending and why a spending limit based on a maximum of the rate of population growth plus inflation would put us back on track to prosper; and 2) Sound Fiscal Policy: Why I believe that the only tax the governments should have in a 21st-century economy to fund limited government is a final sales tax, and the benefits of eliminating property, income, and corporate taxes and the problems with carbon taxes. You can watch this episode and others along with my Let People Prosper Show on YouTube or listen to it on Apple Podcast, Spotify, Google Podcast, or Anchor. Please share, subscribe, like, and leave a 5-star rating!
For show notes, thoughtful insights, media interviews, speeches, blog posts, research, and more, check out my website (https://www.vanceginn.com/) and please subscribe to my newsletter (www.vanceginn.substack.com), share this post, and leave a comment. Today, I'm honored to be joined by Patrick Gleason, Vice President of State Affairs at Americans for Tax Reform. We discuss: 1) How the state flat tax revolution has swept across the country over the last two years, which states have joined, and why it is a beneficial change for more flourishing; 2) Misconceptions about flat taxes, Kansas as an example of how to make tax relief fail, and the need for responsible state budgets; and 3) Patrick's current work on tax and school choice reform across states. Gleason’s bio:
You can watch this interview on YouTube or listen to it on Apple Podcast, Spotify, Google Podcast, or Anchor. Please share on social media, subscribe to your favorite platform and my newsletter, like it, and leave a 5-star rating. Find show notes, thoughtful economic insights, media interviews, speeches, blog posts, research, and more at my website and my Substack newsletter. |
Vance Ginn, Ph.D.
|

 RSS Feed
Proudly powered by Weebly