|
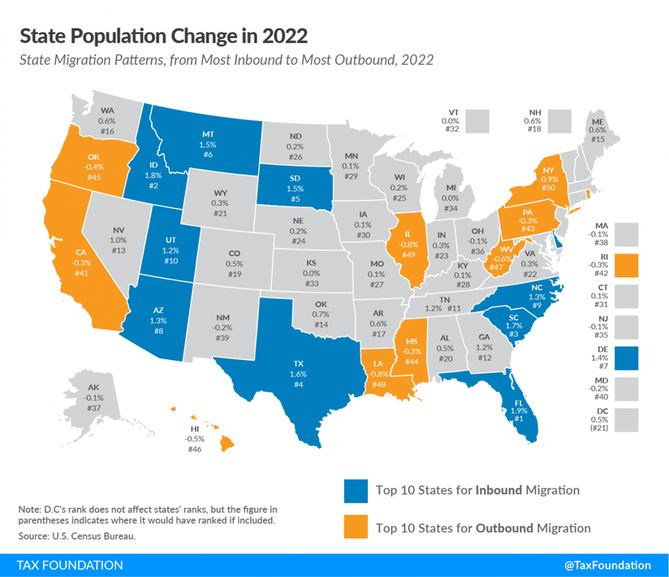
Our new jobs report highlights Louisiana’s economic situation based on the most recent data. The report is based on several key factors that indicate how the economy, labor market, and public policy influence the lives of everyday Louisianans. While some of these data indicate a relatively strong labor market–such as the historically low unemployment rate–there are underlying factors showing Louisiana’s economic struggle. Moreover, the data show that Louisiana lost 36,857 residents from 2021-2022, ranking third worst in the nation. Louisiana’s comeback story will happen through reforms that remove government barriers, bring jobs and opportunity back to Louisiana, and let people prosper. We must decide: Will we continue to hold on to the status quo (which hasn’t done us any favors), or will we embrace the significant reforms necessary to bring jobs and opportunity to Louisiana? We need the latter. Read the full two-pager: Originally published at Pelican Institute.
0 Comments
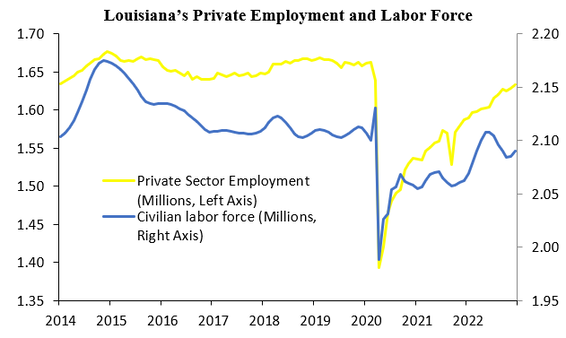
Key Point: Louisiana’s labor market looks okay even as the unemployment rate increased by 0.2-percentage point to 3.5% unemployment rate. But the labor force has 10,622 (-0.5%) fewer people in it than pre-shutdown in February 2020 and private sector employment is 30,000 (-1.8%) below then, indicating a much weaker labor market and economy overall. Labor Market: A job is the best path to prosperity as work brings dignity, hope, and purpose to people through life-long benefits of earning a living, gaining skills, and building social capital. The table below shows Louisiana’s labor market over time until the latest data for December 2022 by the U.S. Bureau of Labor Statistics. The establishment survey shows that net total nonfarm jobs in the state increased by 4,800 jobs last month (+0.2%), bringing this to 50,700 jobs below the pre-shutdown level in February 2020. Private sector employment was up by 4,400 jobs (+0.3%) and government employment rose by 400 jobs (+0.1%) last month. Compared with a year ago, total employment was up by 46,200 jobs (+2.4%) with the private sector adding 45,600 jobs (+2.9%) and the government adding 600 jobs (+0.2%). The household survey finds that the civilian labor force rose by 5,028 people last month and is down 10,622 people since February 2020, which results in the labor force participation rate of 58.5% being 0.1-percentage point lower than it was in February 2020 but well below the 61.2% rate in June 2009 at the trough of the Great Recession. The employment-population ratio is 0.9-percentage point above where it was in February 2020 and nearly back to where it was in June 2009. While the unemployment rate of 3.5% is substantially lower than the 5.2% rate in February 2020, a broader look at Louisiana’s labor market rather than this weak indicator shows that Louisianans still face challenges, especially compared with neighboring states based on several measures. Economic Growth: The U.S. Bureau of Economic Analysis (BEA) recently provided the real (inflation-adjusted) gross domestic product (GDP) in Q3:2022 for Louisiana and other states. The following table shows how U.S. and Louisiana economies performed since 2020. The steep declines were during the shutdowns in 2020 in response to the COVID-19 pandemic, which was when the labor market suffered most. The decline in real GDP annualized growth of -3% in Q2:2022 was the 5th worst and increase of +2.5% in Q3:2022 ranked 23rd in the country. The BEA also reported that personal income in Louisiana grew at an annualized pace of +5.8% (ranked 19th) in Q2:2022 (tied +5.8% U.S. average) and of +2.5% (ranked 47th) in Q3:2022 (below +5.3% U.S. average). Bottom Line: Louisianans gained jobs in December but continue to feel the costs of the shutdowns in 2020 and other restrictive policies that reduce opportunities for them to find well-paid jobs. Institutions matter to human flourishing in countries and states, which is floundering in Louisiana compared with many other states. The Fraser Institute recently ranked Louisiana 20th for economic freedom based on 2020 data for government spending, taxes, and labor market regulation. And the Tax Foundation recently ranked the Pelican State as having the 12th worst business tax climate and 15th highest corporate income tax rate. While the state has improved its tax code recently and lower taxes may happen soon from an expected budget surplus, this lack of economic freedom and poor business tax climate are contributing to a net outmigration of Louisianans to other states, which is a drain on the state’s economic potential now and in the future. State and local policymakers should work to reverse this trend by passing pro-growth policies. Free-Market Solutions: In 2023, the Louisiana Legislature should provide the state’s comeback story by:
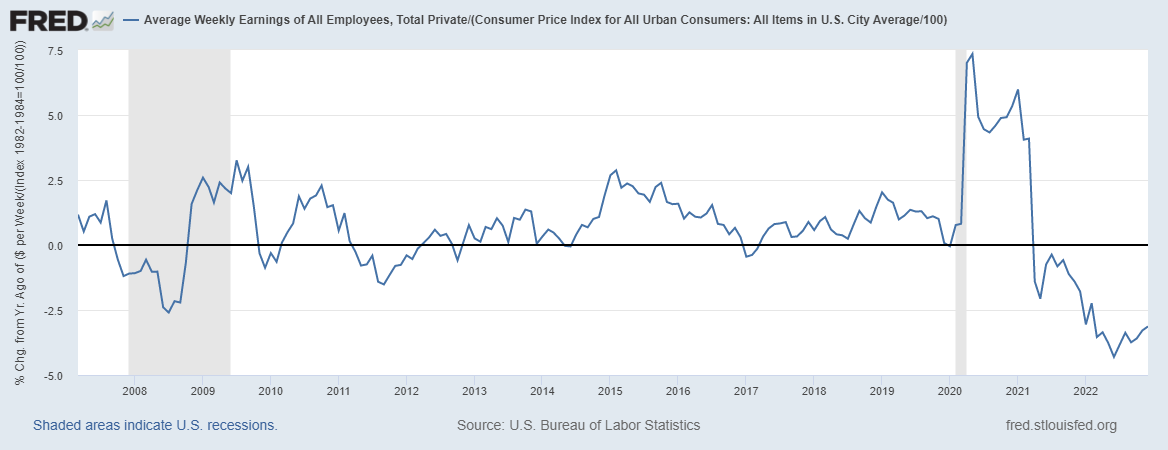
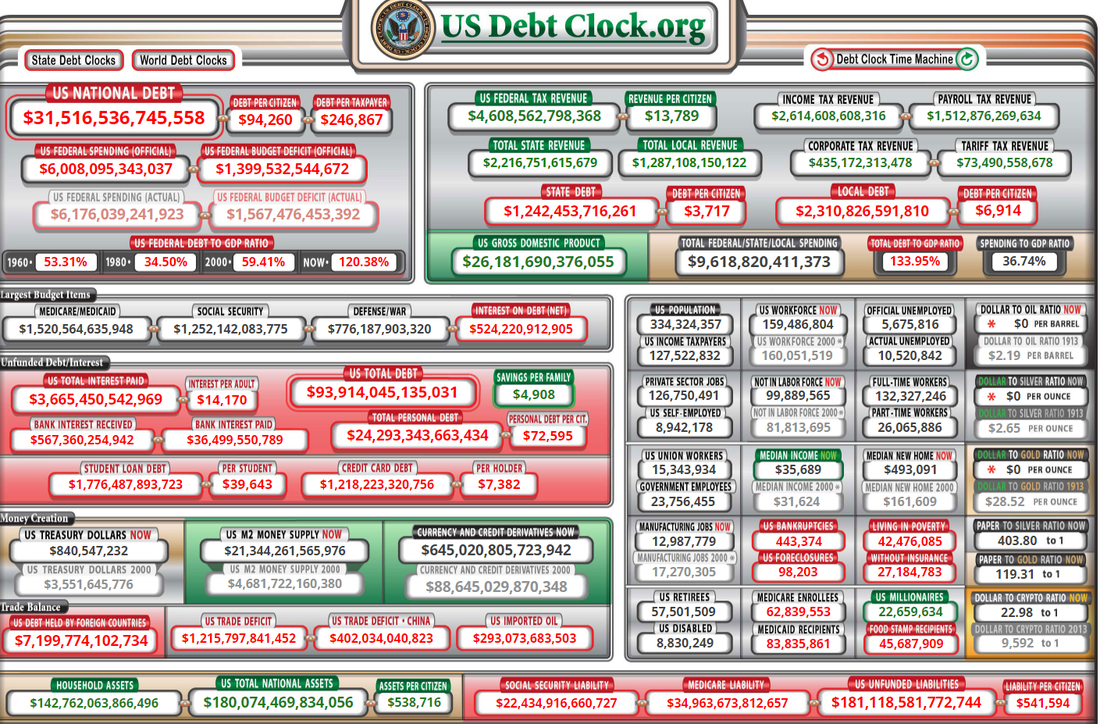
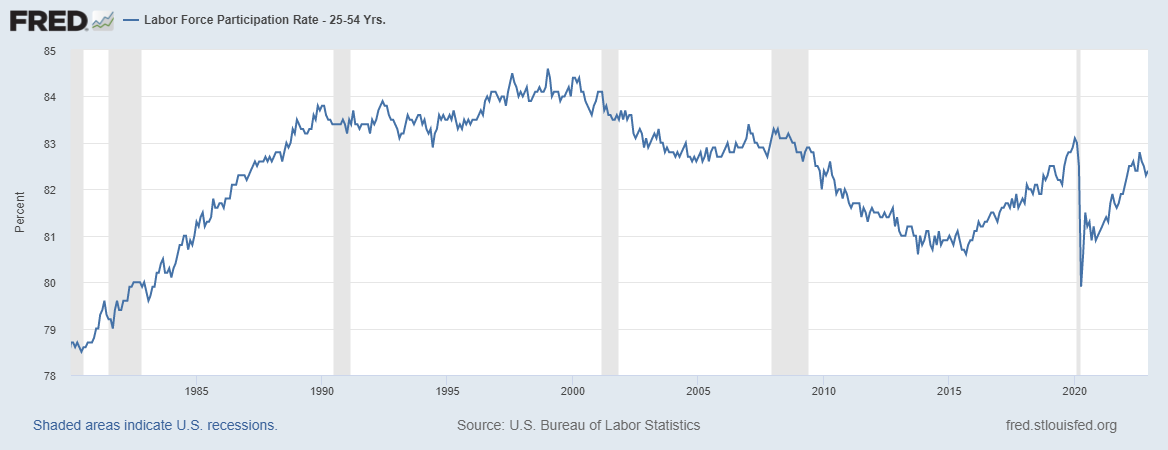
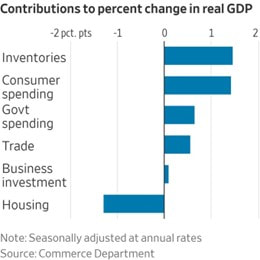
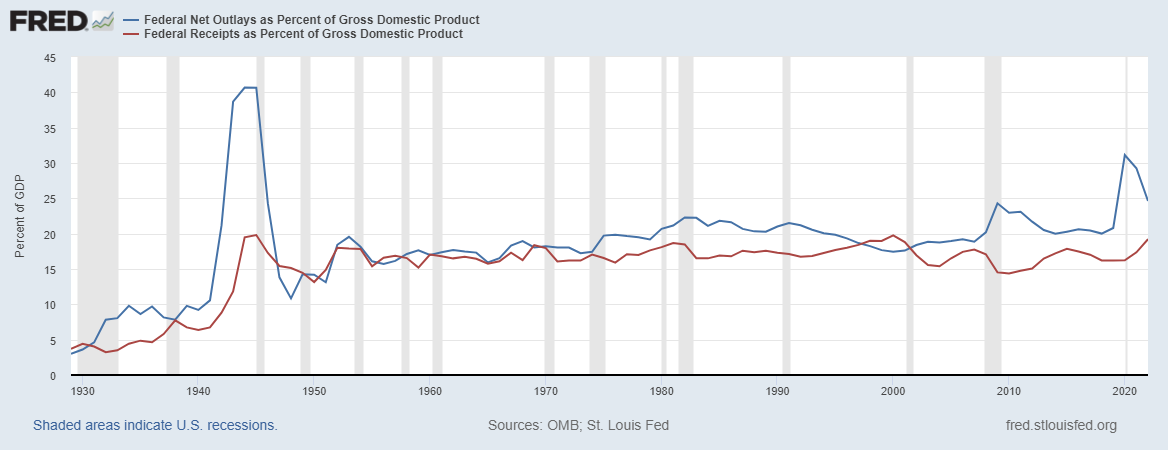
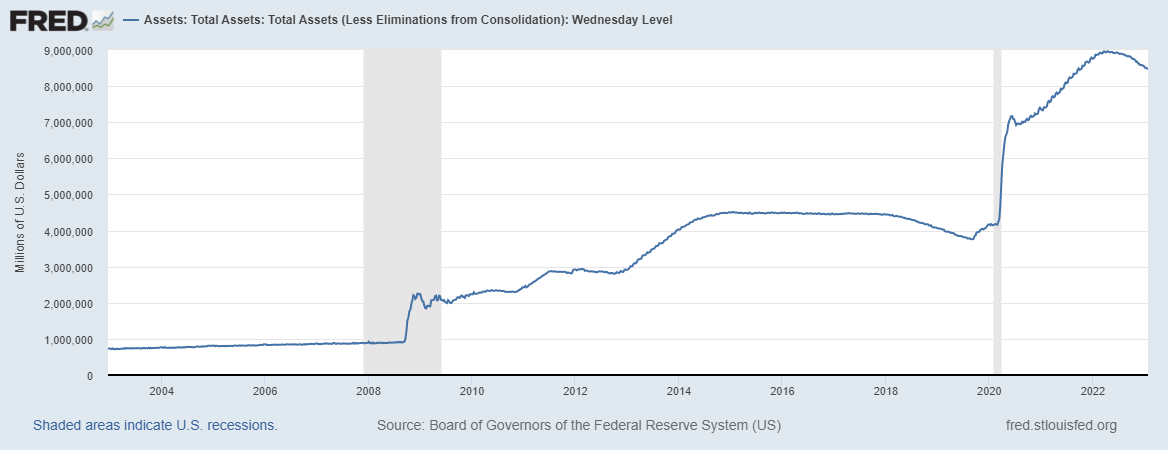
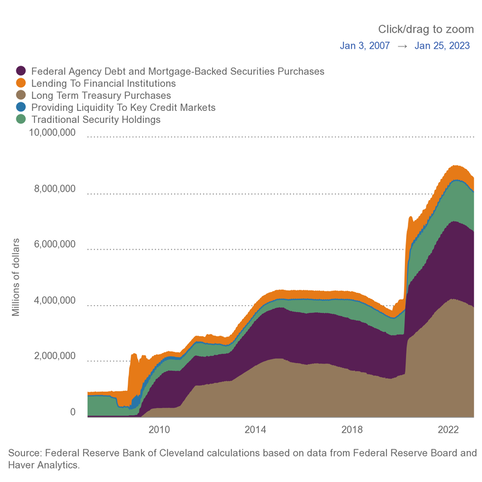
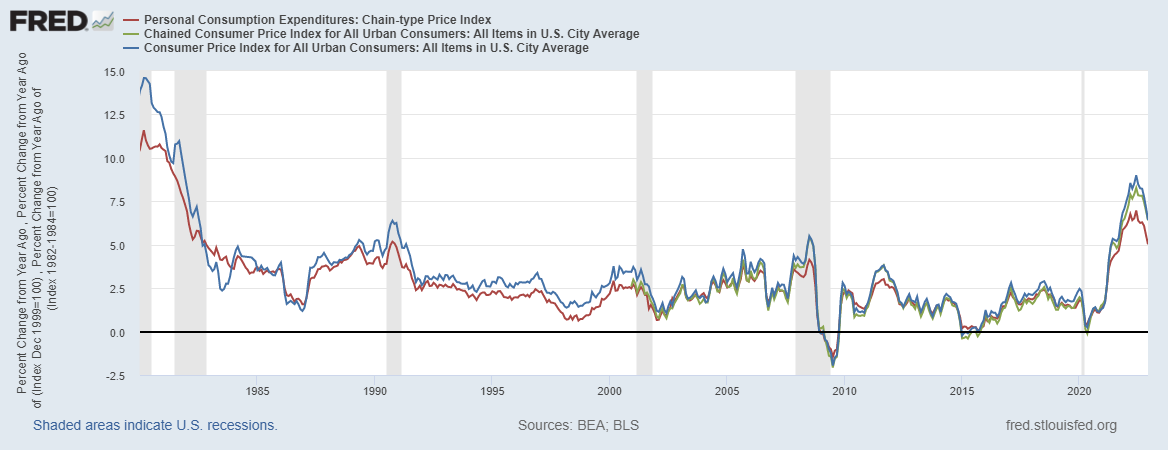
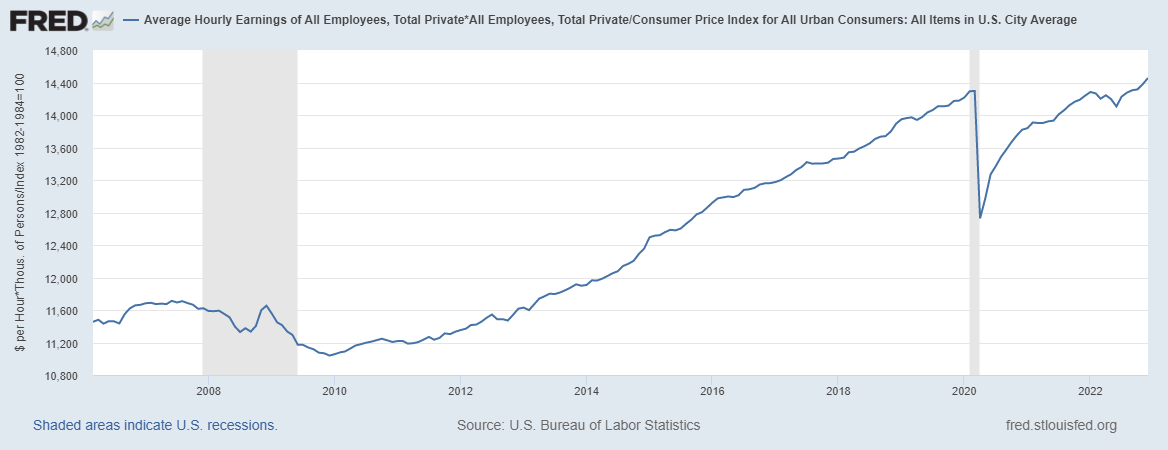
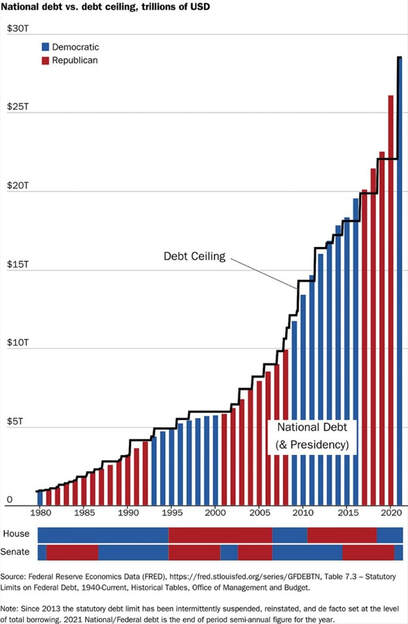
Key Point: Americans are suffering under big-government policies as average weekly earnings adjusted for inflation are down for 21 straight months. It's time for pro-growth policies to unleash economic potential to let people prosper. Overview: The irresponsible “shutdown recession” and subsequent government failures have led to a longer, deeper recession with high inflation that are having persistent consequences for many Americans’ livelihoods. This includes excessive federal spending redistributing scarce private sector resources with deficit spending of more than $7 trillion since January 2020 to reach the new high of $31.4 trillion in national debt—about $95,000 owed per American or $250,000 owed per taxpayer. This new debt has hit its limit and needs to be addressed with spending restraint as the Federal Reserve monetized most of the new debt, leading to a 40-year-high inflation rates. The failed policies of the Biden administration, Congress, and the Fed must be replaced with a liberty-preserving, free-market, pro-growth approach by the new majority by House Republicans so there are more opportunities to let people prosper. Labor Market: The U.S. Bureau of Labor Statistics recently released the U.S. jobs report for December 2022. The BLS’s establishment report shows there were 223,000 net nonfarm jobs added last month, with 220,000 added in the private sector. Interestingly, while there have appeared to be a relatively robust number of jobs created, a recent report by the Philadelphia Fed find that if you add up the jobs added in states in Q2:2022 there were just 10,500 net new jobs rather than more than 1 million initially estimated. This further indicates that the recession started in (likely) March 2022 (more on this below). That expected revision to the establishment report supports the weak data in the BLS’s household survey, which employment increased by 717,000 jobs last month but had declined in four of the last nine months for a total increase of 916,000 jobs since March 2022. This number of net jobs added since then is much lower than the report 2.9 million payroll jobs in the establishment. The official U3 unemployment rate declined slightly to 3.5%, but challenges remain, including: 3.1% decline in average weekly earnings (inflation-adjusted) over the last year, 0.4-percentage point lower prime-age (25–54 years old) employment-population ratio than in February 2020, 0.6-percentage point below prime-age labor force participation rate, and 1.0-percentage-point lower total labor-force participation rate with millions of people out of the labor force. These data support my warnings for months of stagflation, recession, and a “zombie economy.” This includes “zombie labor” as many workers are sitting on the sidelines and others are “quiet quitting” while there’s a declining number of unfilled jobs than unemployed people to 4.5 million And that demand for labor is likely inflated from many “zombie firms,” which run on debt and could make up at least 20% of the stock market and will likely lay off workers with rising debt costs. Economic Growth: The U.S. Bureau of Economic Analysis’ released economic output data for Q4:2022. The following provides data for real total gross domestic product (GDP), measured in chained 2012 dollars, and real private GDP, which excludes government consumption expenditures and gross investment. The shutdown recession in 2020 had GDP contract at historic annualized rates because of individual responses and government-imposed shutdowns related to the COVID-19 pandemic. Economic activity has had booms and busts thereafter because of inappropriately imposed government COVID-related restrictions in response to the pandemic and poor fiscal policies that severely hurt people’s ability to exchange and work. Since 2021, the growth in nominal total GDP, measured in current dollars, was dominated by inflation, which distorts economic activity. The GDP implicit price deflator was +6.1% for Q4-over-Q4 2021, representing half of the +12.2% increase in nominal total GDP. This inflation measure was +9.1% in Q2:2022—the highest since Q1:1981—for a +8.5% increase in nominal total GDP that quarter. This made two consecutive declines in real total (and private) GDP, providing a criterion to date recessions every time since at least 1950. In Q3:2022, nominal total GDP was +7.6% and GDP inflation was +4.4% for the +3.2% increase in real total GDP. But if inflation had been as high as it was in the prior two quarters or had the contribution of net exports of goods and services (driven by natural gas exports to Europe) not been 2.9%, real total GDP would have either declined or been essentially flat for a third straight quarter. In Q4:2022, there was a similar story of weaknesses as nominal total GDP was +6.4% and GDP inflation was +3.5% for the +2.9% increase in real total GDP. But if you consider the +2.9% real total GDP growth was driven by contributions of volatile inventories (+1.5pp), government spending (+0.6pp), and next exports (+0.6pp) which total +2.7pp, the actual growth is quite tepid. For all of 2022, real total GDP growth is reported +2.1% year-over-year but measured by Q4-over-Q4 the growth rate was only +0.96%, which was the slowest Q4-over-Q4 growth for a year since 2009 (last part of Great Recession). The Atlanta Fed’s early GDPNow projection on January 27, 2023 for real total GDP growth in Q1:2023 was +0.7% based on the latest data available. The table above also shows the last expansion from June 2009 to February 2020. The earlier part of the expansion had slower real total GDP growth but had faster real private GDP growth. A reason for this difference is higher deficit-spending in the latter period, contributing to crowding-out of the productive private sector. Congress’ excessive spending thereafter led to a massive increase in the national debt that would have led to higher market interest rates. This is yet another example of how there is always an excessive government spending problem as noted in the following figure with federal spending and tax receipts as a share of GDP. But the Fed monetized much of it to keep rates artificially lower thereby creating higher inflation as there has been too much money chasing too few goods and services as production has been overregulated and overtaxed and workers have been given too many handouts. The Fed’s balance sheet exploded from about $4 trillion, when it was already bloated after the Great Recession, to nearly $9 trillion and is down only about 6% since the record high in April 2022. The Fed will need to cut its balance sheet (see first figure below with total assets over time) more aggressively if it is to stop manipulating so many markets (see second figure with types of assets on its balance sheet) and persistently tame inflation. The resulting inflation measured by the consumer price index (CPI) has cooled some from the peak of 9.1% in June 2022 but remains hot at 6.5% in December 2022 over the last year, which remains at a 40-year high (highest since June 1982) along with other key measures of inflation (see figure below). After adjusting total earnings in the private sector for CPI inflation, real total earnings are up by only 1.1% since February 2020 as the shutdown recession took a huge hit on total earnings and then higher inflation hindered increased purchasing power. Just as inflation is always and everywhere a monetary phenomenon, high deficits and taxes are always and everywhere a spending problem. The figure below (h/t David Boaz at Cato Institute) shows how this problem is from both Republicans and Democrats. As the federal debt far exceeds U.S. GDP, and President Biden proposed an irresponsible FY23 budget and Congress never passed one until the ridiculous $1.7 trillion omnibus in December, America needs a fiscal rule like the Responsible American Budget (RAB) with a maximum spending limit based on population growth plus inflation. If Congress had followed this approach from 2002 to 2021, the (updated) $17.7 trillion national debt increase would instead have been a $1.1 trillion decrease (i.e., surplus) for a $18.8 trillion swing to the positive that would have reduced the cost to Americans. The Republican Study Committee recently noted the strength of this type of fiscal rule in its FY 2023 “Blueprint to Save America.” And the Federal Reserve should follow a monetary rule.
Bottom Line: Americans are struggling from bad policies out of D.C., which have resulted in a recession with high inflation. Instead of passing massive spending bills, like passage of the “Inflation Reduction Act” that will result in higher taxes, more inflation, and deeper recession, the path forward should include pro-growth policies. These policies ought to be similar to those that supported historic prosperity from 2017 to 2019 that get government out of the way rather than the progressive policies of more spending, regulating, and taxing. The time is now for limited government with sound fiscal and monetary policy that provides more opportunities for people to work and have more paths out of poverty. Recommendations:
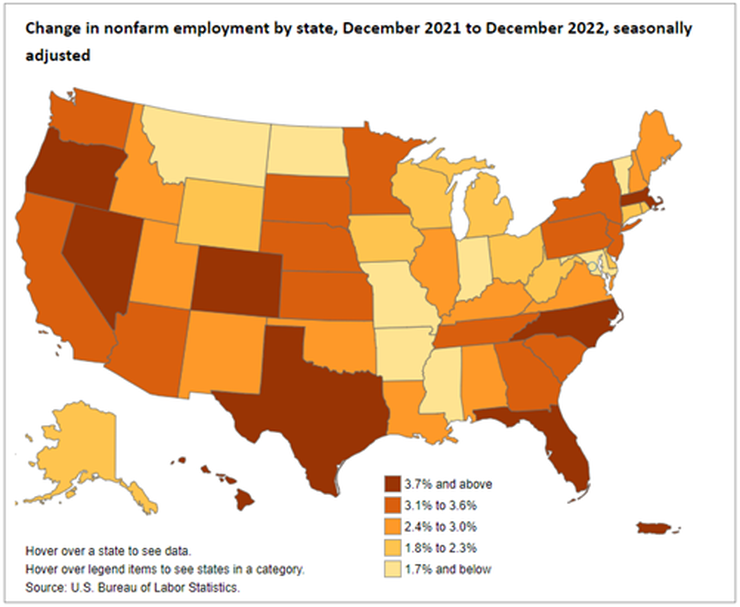
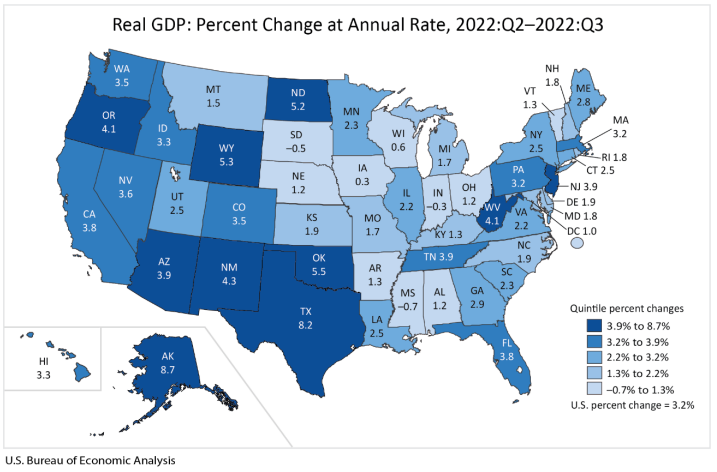
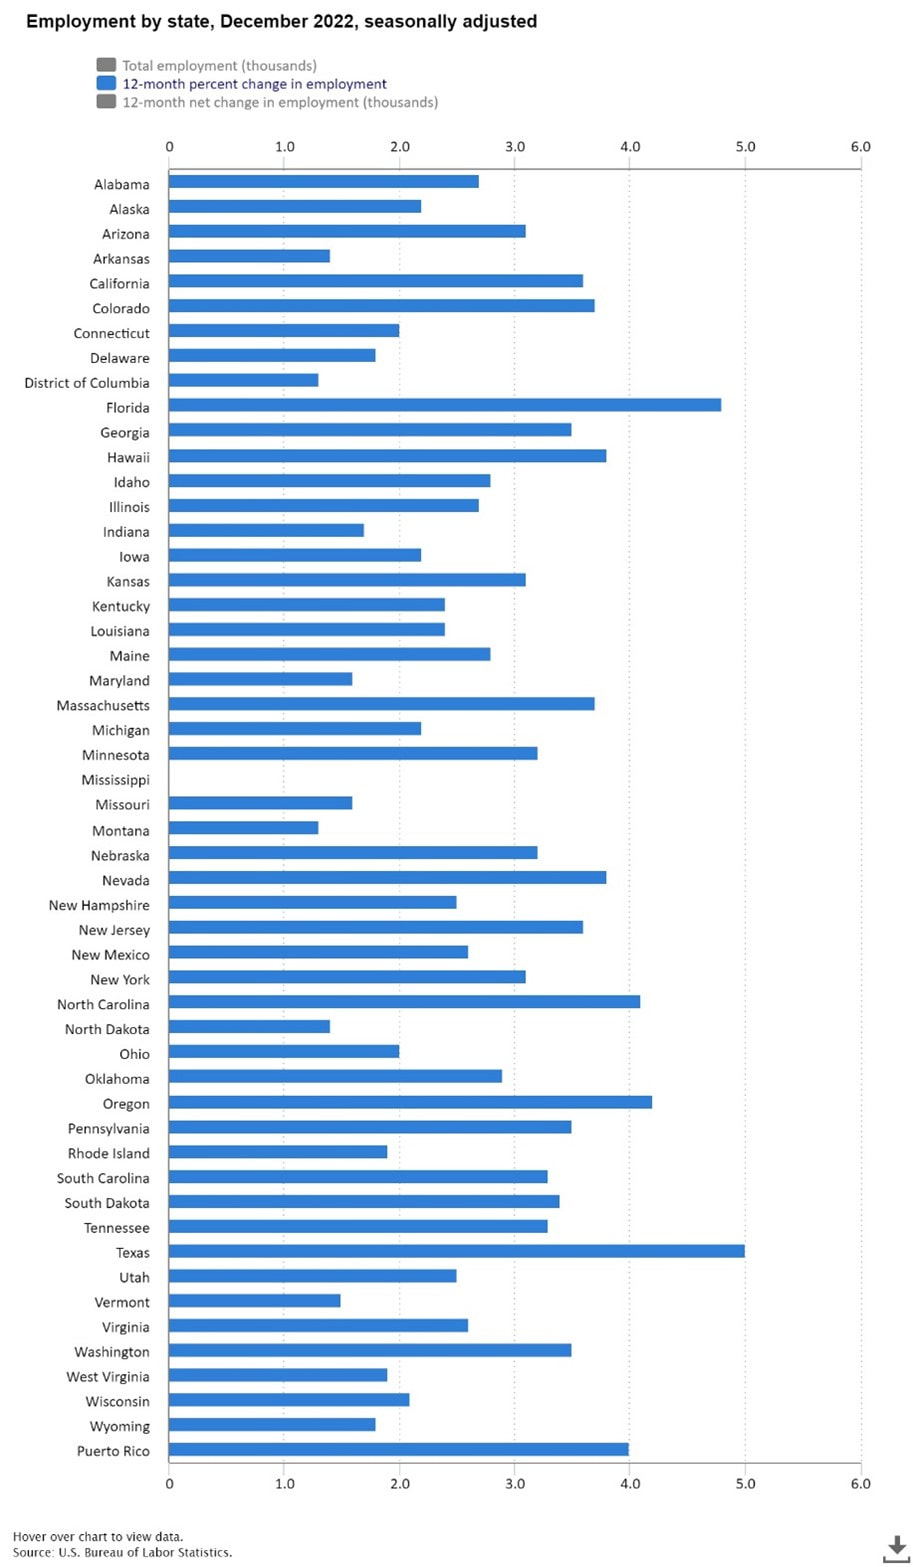
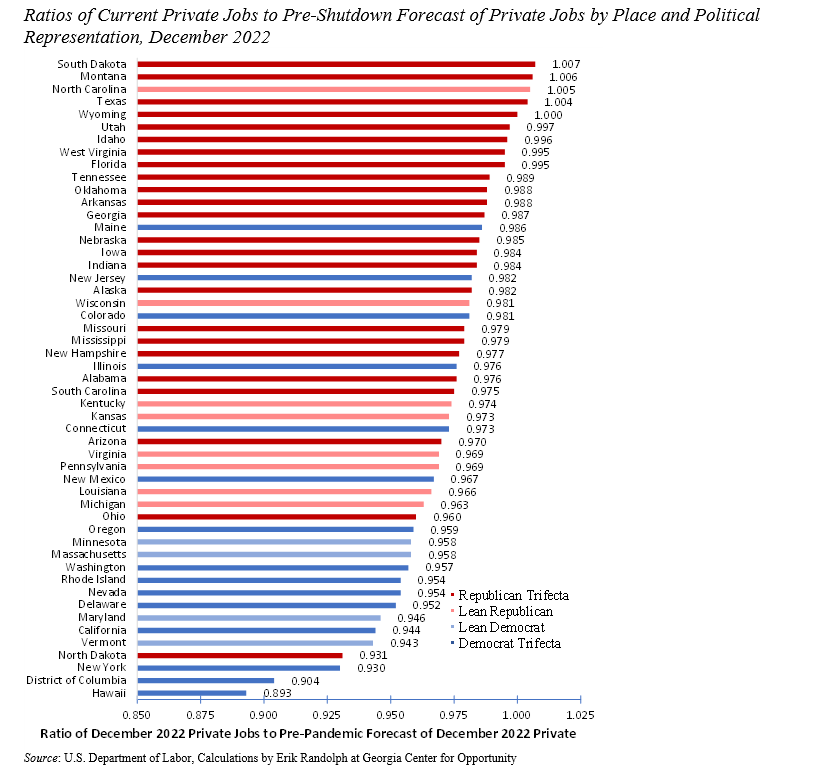
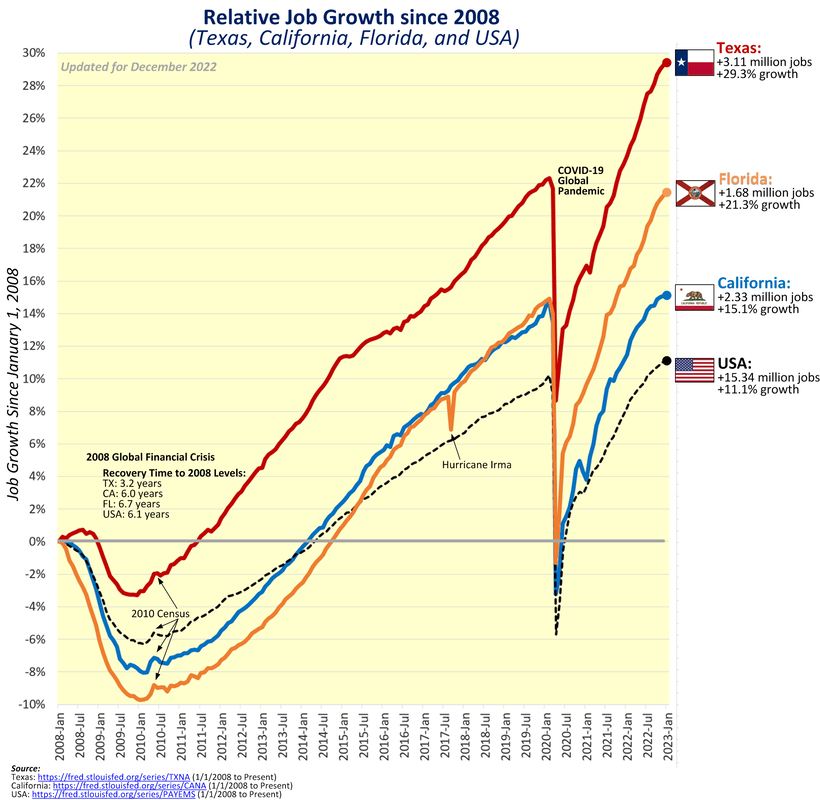
Key Point: Texas continues to lead the way in job creation over the last year (see first figure) and second in economic growth in the third quarter of 2023 (see last figure), but there’s more to do to help struggling Texans deal with the state’s affordability crisis, especially spending, regulating, and taxing less. Overview: Texas has been a national leader in the economic recovery since the inappropriate shutdown recession in Spring 2020. This includes reaching a new record high in total nonfarm employment for the 14th straight month, leading exports of technology products for 20 consecutive years, and being home to more than 50 of the world’s Fortune 500 companies. While the 87th Texas Legislature in 2021 supported the recovery by passing many pro-growth policies like the nation’s strongest state spending limit, there’s more to do in the ongoing 2023 session to remove barriers placed by state and local governments. Labor Market: The best path to prosperity is a job, as it helps bring financial self-sufficiency, dignity, hope, and purpose to people so they can earn a living, gain skills, and build social capital. The table below shows the state’s labor market for December 2022. The establishment survey shows that net nonfarm jobs in Texas increased by 29,500 last month, resulting in increases for 31 of the last 32 months, to bring record-high employment to 13.7 million. Compared with a year ago, total employment was up by 650,100 (+5.0%)—fastest growth rate in the country—with the private sector adding 628,800 jobs (+5.7) and the government adding 21,300 jobs (+1.1%). The household survey shows that the labor force participation rate is slightly higher than in February 2020 but well below June 2009 at the trough of the Great Recession. The employment-population ratio fell was unchanged in November and nearly where it was in February 2020, and the private sector now employs 700,000 more people than then. Texans still face challenges with a worse unemployment rate, though historically low, and nonfarm private jobs just recently above its pre-shutdown trend (Figure 1). The figure below compares the ratio of current private employment to pre-shutdown forecast levels in red states and blue states if both chambers of the legislature and the governor are Republican (dark red), Democrat (dark blue), or some combination (lighter colors). The results show a clear distinction between red states and blue states, with the stringency of restrictions by governments during the pandemic along with pro-growth policies before and after the shutdowns playing key roles. Specifically, 21 of the 25 states with the best (highest) ratios are in red-ish states while 13 of the 15 states and D.C. with the worst (lowest) ratios are in blue-ish places as of December 2022. The following figure from Soquel Creek on Twitter tells the story even more directly: those states with more economic freedom prosper more than those with less economic freedom (see rankings in Fraser Institute's Economic Freedom of North America report: FL ranks #1, Texas ranks #4, California ranks #49, and New York ranks #50). Overall, multiple indicators should be considered in this nuanced labor market, such as the fact that the unemployment rate is a weak indicator as many have dropped out of the labor force. While the labor force participation rate in Texas slightly exceeds where it was before the shutdowns, and the 3.9% unemployment rate could be considered full employment, the employment-population ratio is 0.2-percentage point below the pre-shutdown ratio. Economic Growth: The U.S. Bureau of Economic Analysis (BEA) recently provided the real gross domestic product (GDP) by state for Q3:2022. The Figure below Texas had the second fastest GDP growth (first is Alaska) of +8.2% on an annualized basis to $1.89 trillion (above the U.S. average of +3.2% to $20.05 trillion). In the prior quarter, Texas had the fastest growth with +1.8% growth as the U.S. average declined by -0.6% that quarter. Of course, these followed Texas’ GDP contractions of -7.0% in Q1:2020 and -28.5% in Q2 during the depths of the shutdown recession. Fortunately, GDP rebounded in Q3 and Q4, yet declined overall in 2020 by -2.9% (less than -3.4% decline of U.S. average) but increased by +3.9% in 2021 (below the +5.9% U.S. average). The BEA also reported that personal income in Texas grew at an annualized pace of +6.9% in Q3:2022 (ranked 6th highest and faster than the U.S. average of +5.3%) but slower than the robust +8.4% in Q2:2022 (ranked 6th best and above the U.S. average of +4.9%) as job creation and inflated income measures found their way across the economy. 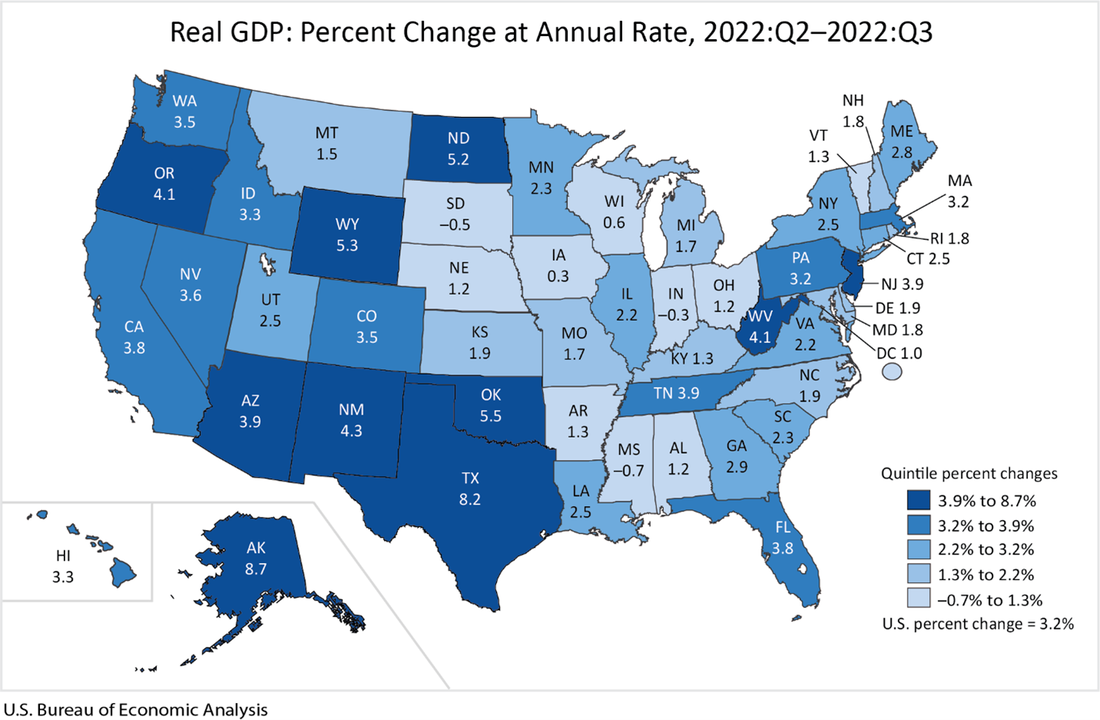 Bottom Line: As Texas recovers from the shutdown recession and faces an uncertain future with the U.S. economy having stagflation and a likely recession, Texans need substantial relief to help make ends meet. Other states are cutting, flattening, and phasing out taxes, so Texas must make bold reforms to support more opportunities to let people prosper, mitigate the affordability crisis, and withstand destructive policies out of D.C.
Free-Market Solutions: In 2023, the Texas Legislature should improve the Texas Model by:
Get this: For the low price of more than 16,000 tax dollars per student each year, your child can receive one-size-fits-all education that too often prioritizes woke ideology over workforce readiness. What a bargain!
Maybe that’s why so many families have left the public education system over the past few years. School shutdowns, mask and vaccine mandates, and even the lack of safety in the public education system have parents running for the hills. They understand that the deal they’re being offered isn’t a deal at all and that the public school system is broken and in need of serious repair. Teachers have also started leaving the profession in droves. They’ve realized they have little to no negotiating power for better pay or support because the teacher market has a monopsony, with public schools being the dominant consumer of their services. Lack of funding isn’t the problem, as inflation-adjusted total per-student revenue increased by 25% across the country from 2002 to 2020 . So, what's the issue? Schools run by governments and funded by taxpayers, known as “public schools,” fail the economic test of being a standard public good and are designed to benefit politically motivated bureaucrats , not parents, teachers, or students. Regardless of whether these government schools are the best option for their child, parents are forced to pay taxes to fund them. Parents in less-privileged situations are usually stuck sending their children to the local government-run school, while wealthier parents may have the luxury of choosing to pay for another path. But it doesn’t have to stay this way. Some states are already showing us how to improve the education system through school choice . Education freedom puts education funds where they belong: in the parents’ pockets and out of the hands of self-interested bureaucrats. Former Arizona Gov. Doug Ducey started the school choice revolution last year with the Empowerment Scholarship Accounts . And this week, Iowa Gov. Kim Reynolds signed a universal school choice bill into law. Both states created education savings accounts that will give families about $7,000 per student per year to spend on any school-related expense, including private school tuition, home-school curriculum, tutors, etc. Of course, Democrats and others tied to the government-schooling monopoly have found reason to raise alarm bells over this students-first movement. And they’re diligently spreading misinformation, including arguments that school choice would increase inequality. But the opposite is true. With an Arizona- or Iowa-style school choice solution, all students receive the same financial support, regardless of their parents’ income, and public schools still receive funding, even if parents choose another option. In fact, school choice breaks public schools’ monopoly and levels the playing field more than any other reform. These policies make sure that single, working, and disabled parents have the exact same educational resources for their children as wealthier parents. Breaking the monopsony situation through school choice would benefit teachers. Suddenly, public schools would have the incentive to lower costs and improve pay for quality teachers so there are better outcomes, and teachers would have more job options. In other words, schools would be forced to compete. That’s why school choice has been proven to improve the quality of public schools — competition helps increase incentives to hire and keep good teachers and provide a better curriculum. And if government school enthusiasts are concerned about losing funding, they should first ask themselves why those schools would lose funding if they’re as good as the education establishment claims. Our public school system is a failing bureaucratic nightmare that puts students last. And this is contributing to fewer education outcomes, more poverty, and higher crime. School choice can — and will — change that. Originally posted at Washington Examiner By Victor Skinner | The Center Square contributor | Jan 26, 2023
(The Center Square) — New analysis shows Louisiana’s top corporate income tax rate is the 15th highest in the nation, a reality critics contend is holding the state back. Analysis from the Tax Foundation released Tuesday shows that out of the 44 states that levy a corporate income tax, Louisiana’s top 7.5% rate ranks 15th from the top, the highest in the region. Neighboring Texas does not levy a corporate income tax and instead imposes a gross receipts tax on businesses, while Arkansas’ 5.3% rate ranked 33rd, and Mississippi’s 5% rate ranked 34th. "The rate is too high, 7.5% ranking 15th in the nation means Louisiana is less competitive, especially with its neighbors," Vance Ginn, chief economist at the Pelican Institute, told The Center Square. Ginn noted that the corporate income tax ranking follows a previous report from the Tax Foundation that ranked Louisiana as the 12th lowest state for business tax climate, a measure that takes into account other factors. He contends lawmakers can take action to improve the situation. "What we’ve been looking at is finding ways to flatten the corporate income tax," Ginn said, noting that the state’s current system has three brackets. Reducing the three brackets into one would help in the short term, he said, but the long-term focus should be on "eliminating the income tax and finding ways to limit government spending," he said. "What we’ve been looking at is using surplus funds to buy down the corporate tax," Ginn said. Louisiana "really ultimately needs to be more competitive," he said. "People are moving out. Businesses are moving out." Ginn pointed to recent U.S. Census data that shows 67,508 residents left the Pelican State between April 1, 2020 and July 1, 2022, with most of the loss through domestic migration. The Tax Foundation identified 44 states that levy a corporate income tax, which ranged from North Carolina’s 2.5% rate to 11.5% in New Jersey. Behind the Garden State is Minnesota at 9.8%, Illinois at 9.5%, and Alaska and Pennsylvania, which levy top corporate tax rates of 9.4% and 8.99%, respectively. There are 11 states with top rates at or below 5%. North Carolina is followed by Missouri and Oklahoma at 4%, North Dakota at 4.31%, Colorado at 4.55%, Utah at 4.85%, Arizona and Indiana at 4.9%, and Kentucky, Mississippi, and South Carolina at 5%. Nevada, Ohio, Texas, and Washington use a gross receipts tax instead of corporate income taxes, while Delaware, Oregon, and Tennessee impose both gross receipts taxes and corporate income taxes. "Though often thought of as a major tax type, corporate income taxes accounted for an average of just 7.07% of state tax collections and 4.04% of state general revenue in fiscal year 2021," according to the report. "And while these figures are not high, they represent a substantial increase over prior years. Corporate income taxes accounted for 2.26% of general revenue in FY 2020, which is more in line with historical norms." Originally published at The Center Square. Occupational licensing hinders individuals attempting to work in their chosen field, often with little benefit to the public. Key points – Occupational licenses should only be required where there is a clear and convincing need to protect the health and safety of the public and the license is reasonably expected to achieve that protection. – Texas has taken important strides in recent years to reduce the number of unnecessary occupational licenses, but more needs to be done. – Occupational licenses should be reviewed and eliminated if determined to be unnecessary to protect the health and safety of the public. Originally posted at TPPF. Social Security is on the verge of a funding crisis, and there's renewed debate about how to fix it.
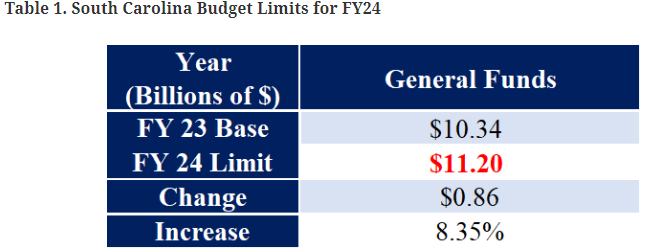
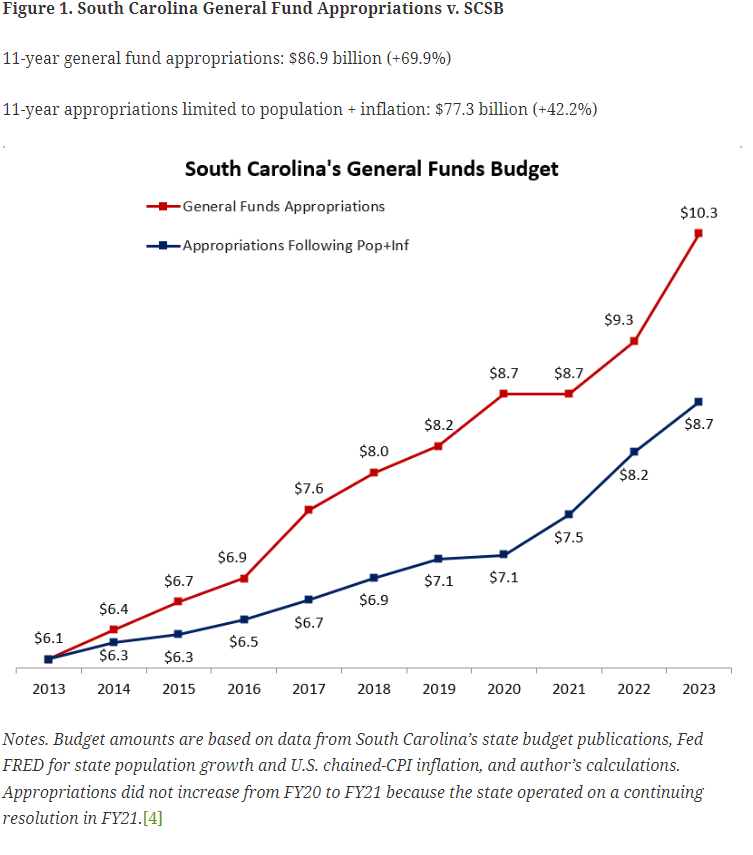
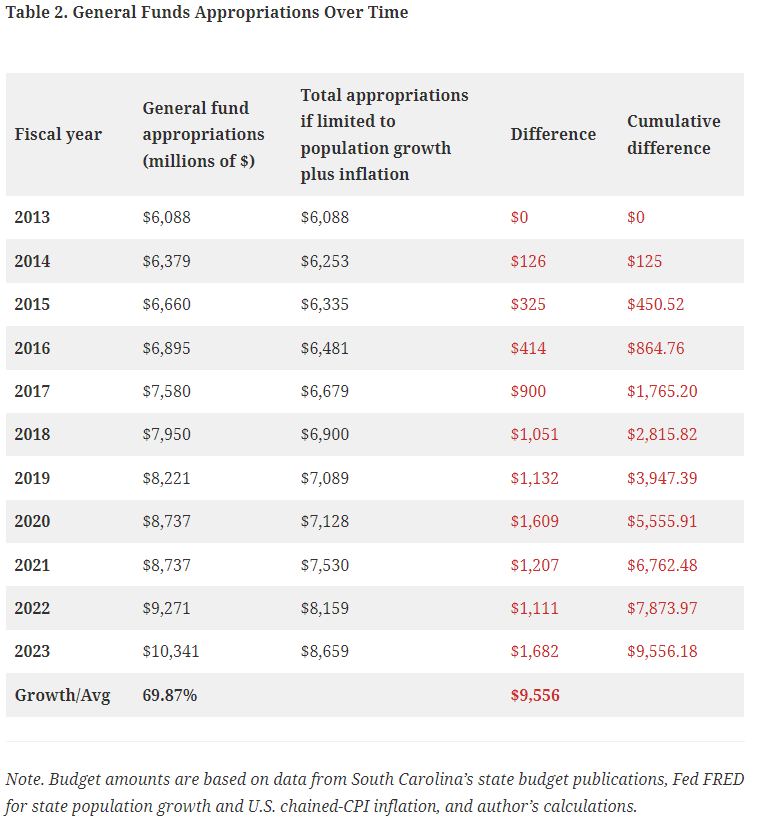
Members of Congress are proposing several ways to shore up social security. It's top of mind for many after a December report by the Congressional Budget Office that says two trust funds used to pay for Social Security will be depleted by 2033. Some say the solution is simple: change the date on which excess reserves are invested, thus saving the program money. Economist Vance Ginn says that might help, but it won't fix the bigger problem. “There’s a lot more payments going out compared to the amount of benefits or taxes or interests that’s being put into the trust fund,” Ginn explained. Some Democrats have proposed raising taxes on the rich to fund Social Security. While Republicans, like Representative Rick Allen of Georgia, have proposed raising the age of retirement. Originally posted at KTRH News in Houston, Texas. South Carolina is getting on the right track when it comes to fiscal responsibility. In 2022, state lawmakers and Gov. Henry McMaster enacted the first-ever state personal income tax cuts, letting residents keep more of their hard-earned money and making South Carolina more competitive for business. Last year, voters also approved ballot measures requiring the state government to set more money aside in the event of an economic downturn. The next step is to get state spending under control, which can be achieved by following the Policy Council’s South Carolina Sustainable Budget (SCSB). The SCSB provides a limit for annual general funds[1] appropriations using data based on the rate of state population growth plus inflation. This report provides appropriations recommendations for fiscal year (FY) 2024 and compares recent state appropriations with what spending would have looked like under a sustainable budget. Based on population and inflation data in 2022, the recommended general funds appropriations limit[2] for South Carolina’s FY24 budget is $11.2 billion. However, with inflation reaching a 40-year high, primarily because of the errant policies in D.C., this spending ceiling is higher than it would otherwise be under normal economic circumstances. Accordingly, the S.C. Legislature should consider freezing spending at the current FY23 budget amount of $10.34 billion. This would help to correct recent overspending seen in South Carolina’s budget and put our state on a more sustainable path. At a minimum, general fund appropriations in the FY24 budget must remain below $11.2 billion. Overview A sustainable budget, sometimes called a conservative or a responsible budget, is a model for state budgeting that limits appropriations based on population growth plus inflation. This metric serves as an indicator of what the average taxpayer can afford to pay for government provisions. In particular, it accounts for: 1) More people in the state who could potentially pay taxes, 2) Wage growth that’s typically tied to inflation over time to pay taxes, and 3) Economies of scale, as not every new person or wage increase should be associated with new government spending. The SC Sustainable Budget does not make specific recommendations on how general funds should be appropriated. Rather, it gives legislators the flexibility to appropriate taxpayer dollars to government programs as determined by the General Assembly while ensuring that spending growth remains in line with what people can afford. Such a voluntary spending limit is key to putting South Carolina in a position for further tax relief. In 2022, lawmakers cut and simplified our state personal income taxes – a policy supported by the Policy Council – and set up a trigger for additional, smaller cuts in the future. But smart budgeting will help accelerate the process of reducing income taxes and fuel other tax cuts. Unsustainable spending, on the other hand, could build pressure to reverse course and raise taxes, leaving South Carolinians with fewer opportunities to flourish. SC Appropriations vs. Sustainable Budget Figure 1 compares the previous eleven years[3] of South Carolina’s general fund appropriations (FY13 to FY23) to general fund appropriations if limited to the rate of population growth plus inflation, with the following results: Key takeaways (see Table 2):
Follow the sustainable budget
As legislators begin working on South Carolina’s next budget, we strongly encourage them to follow the SCSB, which establishes a spending limit based on what the average state taxpayer can afford to pay for government services. The SCSB does not instruct lawmakers how to spend funds, rather its purpose is to keep overall spending from rising too quickly. Such budgetary restraint will be vital going forward. In its November 2022 report, the S.C. Board of Economic Advisors forecasted $12.3 billion in general fund revenue for FY24, with expected revenue for FY23 being $12.5 billion – a 1.3% decline. Moreover, the FY23 revenue estimate is 8.7% less than actual revenues of $13.7 billion for FY22. If these estimates materialize, it will mark an end to years of major growth in state revenue collections. The good news is that South Carolina is already taking steps to prepare for a rainy day. Voters recently approved two amendments to increase contributions to the state reserve funds – raising the General Reserve Fund from 5% to 7% and the Capital Reserve Fund from 2% to 3% of the previous year’s general fund revenue. By law, the reserve funds act primarily as a shield against year-end budget deficits. By doubling down on smart policy and following the SCSB, our state will be in a much stronger position to cut taxes, avoid the tremendous cost of unchecked government growth, and allow citizens to prosper and reach their fullest potential. Originally posted by South Carolina Policy Council. Our country’s economic journey throughout 2022 is one for the books. We had the highest inflation in 40 years , the highest mortgage rates in 20 years , and the worst stock market declines in 14 years . People are still struggling to pay bills, reduce debt, and save money, with average weekly earnings adjusted for inflation down 3% year over year .
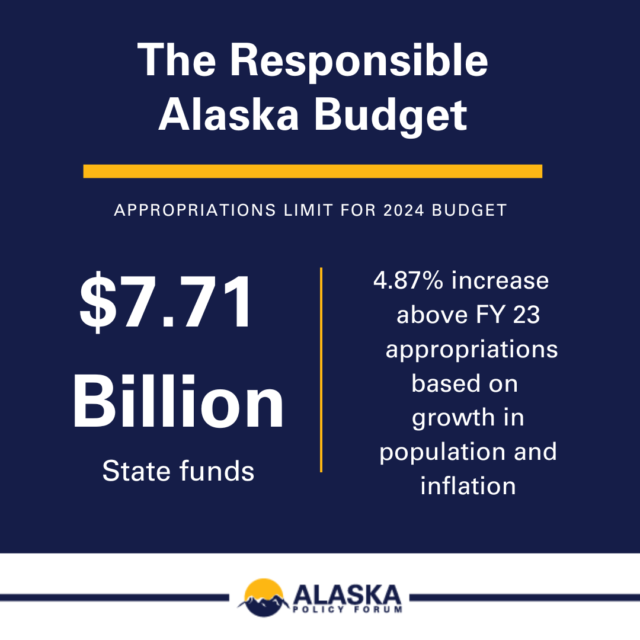
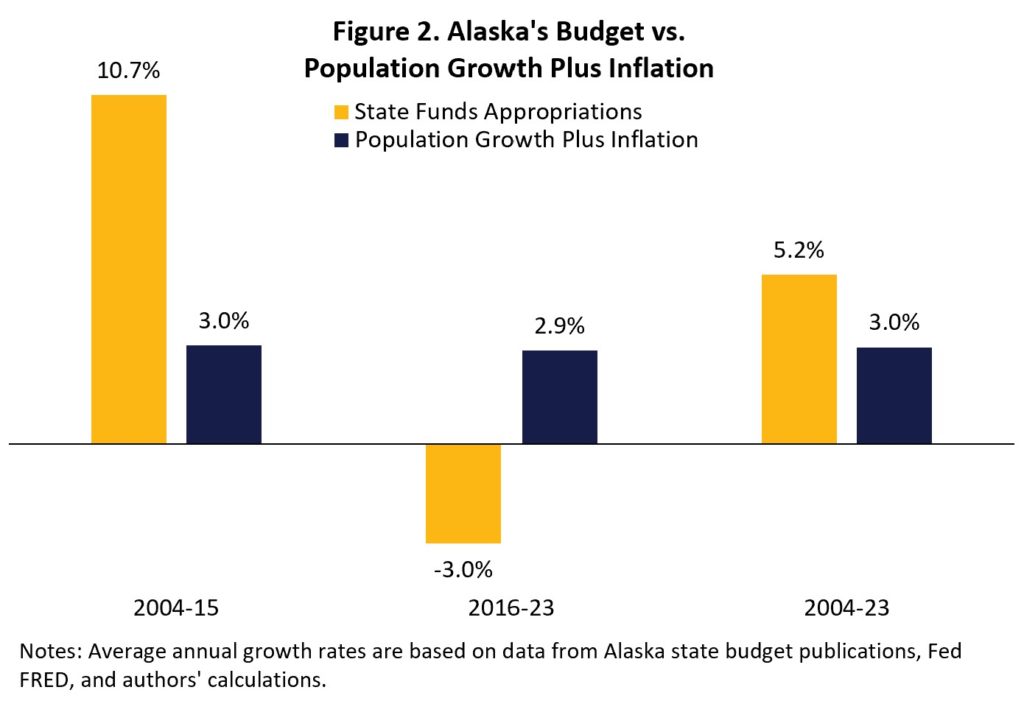
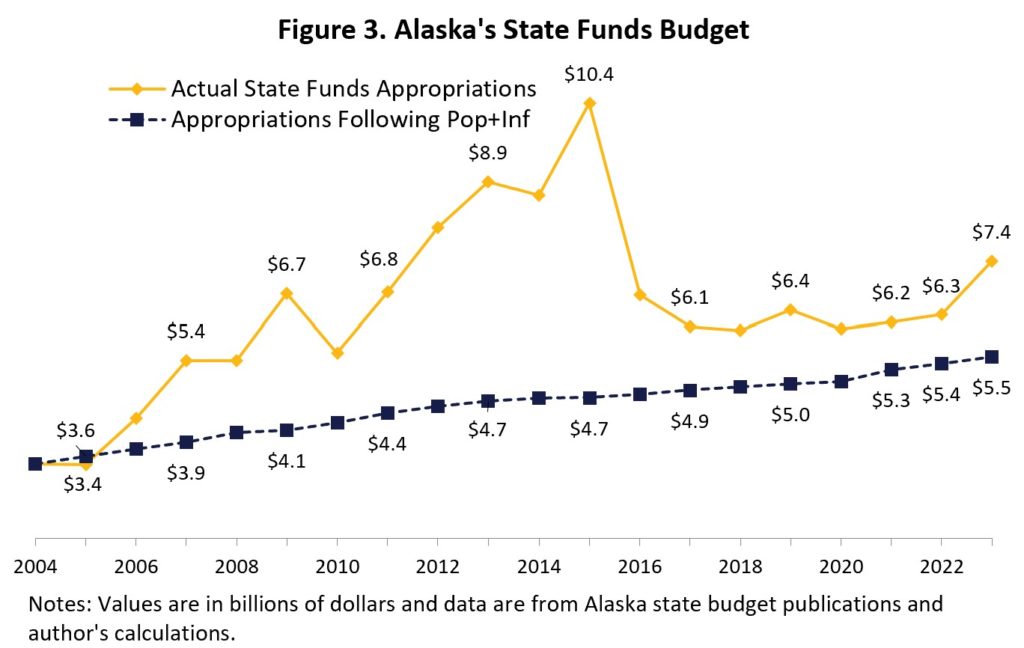
The dismal state of the economy blindsided many people last year, but we don’t have to be caught so unaware in 2023. Knowledge is power, and knowing what could happen this year might make a difference in your finances. I believe that the burden of the inflationary recession will intensify this year. Expect to see the economy continue to correct from the consequences of Congress’s excessive deficit-spending that simply moved our money around, Biden’s overregulation that stifled energy production and other markets, and the Federal Reserve’s monetary mischief that manipulated markets through its bloated balance sheet. Currently, the Fed’s balance sheet remains well over $8.5 trillion , not falling nearly fast enough after it peaked at $8.9 trillion in April 2022. Much of this stems from when the Fed’s balance sheet more than doubled due to pandemic-related shutdowns to help Congress afford massive spending that ballooned the national debt by more than $7 trillion over the last three years. Now, the debt sits at about $31.5 trillion . Adding to the perfect storm is a regulation-happy president, Joe Biden, who hinders the ability of the free market to flourish, particularly in the areas of oil and gas, with his flawed green-energy agenda. The vital ingredients for a suffering economy with continually high inflation and high interest rates are present. The popular misery index (a measurement of economic distress on the everyday person), which uses the unemployment rate plus inflation, was above 10% in December — the highest rate since before the shutdowns in 2012. Given the projection of the economy in 2023, we can expect rising unemployment and elevated inflation as employers cut costs or raise prices to stay afloat. We’ve already seen employment take hits in the household survey, which has shown net employment declined in four of the last nine months for a total increase of just 916,000 jobs added since March 2022. In short, we’re looking at a continued inflationary recession with higher interest rates in 2023. It won’t be pretty, but there’s a reason for hope: a divided Congress. Republicans now have control of the House, and Democrats have control of the Senate and the White House. That division can create roadblocks to poor policies being pushed out of the Biden administration and the Democrat-controlled Senate, which has destroyed economic opportunities over the last two years. But the other possibility is more costly executive orders from Biden as he seeks to push more green energy policies, such as the ESG investing scam or stopping permits for oil and gas, and other flawed initiatives. This would mean more blockades to free-market flourishing. If the economy is prohibited from growing due to excessive regulation, taxation, and spending, we can anticipate that things will get worse before they get better. We’re in this mess because of 2020’s “shutdown recession” and subsequent government failures. The way out is the proven recipe of pro-growth, liberty-enhancing policies of less spending, taxation, and regulation while the Fed aggressively cuts its balance sheet. This would unleash the economic potential of the productive private sector and get people working well-paid jobs while substantially reducing inflation. In the meantime, hardworking people should minimize expenses, save for the storms ahead, and stay connected to family and the community for the smoothest possible sailing throughout what is sure to be a bumpy ride in 2023. Originally published at Washington Examiner. By Vance Ginn and Quinn Townsend Introduction While revenue estimates for the state of Alaska hit a record high last fiscal year, this upcoming fiscal year 2024 (July 2023 – June 2024) is another story. The Fall 2022 revenue forecast is much lower than it has been in previous years. Now more than ever, Alaskans need policymakers to show fiscal responsibility and restraint as they congregate in Juneau to discuss the next state budget. To that end, a responsible budget should not exceed $7.71 billion in state funds. Alaska Policy Forum is releasing its third annual Responsible Alaska Budget (RAB), now for FY 2024, to help effectively limit state spending and restrain the growth of government. The RAB represents a strong fiscal rule in the form of a spending limit which should be passed and added to the state’s constitution as a meaningful appropriation limit. Fiscal restraint allows the state to prioritize the needs of Alaskans without excessively growing the size of government, thus limiting the burden on the private sector where productivity advances improve opportunities for Alaskans to prosper today and for generations to come. There is a need to overcome the economic challenges the state is experiencing and the extravagant spending from 2004 to 2015 in Alaska. The RAB is an essential maximum limit for policymakers this session, and the actual budget should be well below it to help Alaskans deal with economic challenges and to correct past budgeting excesses. Responsible Alaska Budget Calculation The FY 2024 RAB sets a maximum threshold on the upcoming state appropriations based on the summed rate of the state’s resident population growth and inflation, as measured by the U.S. chained-consumer price index (CPI), over the year before the legislative session. This threshold is an upper limit for the enacted budget for all state funds, excluding federal funds, the Permanent Fund Dividend (PFD), and fund transfers. The calculation is found using the growth rate of Alaska’s resident population and adding it to the growth rate of the U.S. chained-CPI. In 2022, the U.S. chained-CPI inflation increased by 4.97%, and Alaska’s population growth declined 0.10%. The sum of these values, an increase of 4.87%, serves as the maximum growth rate for state funds appropriations in FY 2024. With a base approved state funds budget of $7.35 billion in FY 2023, Figure 1 shows that the FY 2024 RAB is a maximum of $7.71 billion. It should be noted that due to reporting consistencies, APF is now using the official budget numbers from the Office of Management and Budget rather than the Legislative Finance Division, resulting in a slightly different calculated FY 2023 RAB than what we published in 2022. And we are using chained-CPI inflation now to account for the substitution effects by consumers who choose different goods and services when there are changes in prices, which are not accounted for with just CPI inflation. The FY 2023 enacted budget was $7.35 billion — $800 million more than the published FY 2023 RAB threshold of $6.55 billion, meaning it was an irresponsible budget. This should be corrected in the FY 2024 budget. Due to higher price inflation over the past year across the country and a decrease in the state’s resident population, the FY 2024 RAB accounts for these with a ceiling growth rate of 4.87% which essentially freezes inflation-adjusted state funds appropriations per capita. In addition to high inflation, Alaskan policymakers will also be struggling with a low revenue forecast, due in part to decreased oil prices and oil production. Alaska’s Department of Revenue estimates an FY 2024 revenue of $10 billion (excluding federal funds), which does include revenue for the Permanent Fund Dividend, an appropriation we do not include in our maximum threshold calculation, as well as state restricted funds. A responsible budget passed by policymakers will take this into consideration, while not relying on the state’s savings accounts. Instead, limiting the growth of government spending to keep more money in the productive private sector will support increased opportunities for Alaskans to achieve their hopes and dreams while helping those struggling to gain the dignity of work by earning a living. Historical Budget Trends Figure 2 shows Alaska’s budget trends since FY 2004. During the period from 2004 to 2015, the average annual budget increased by almost 11%, which was nearly four times faster than the key metric of the rate of population growth plus inflation. Since then, the budget has declined annually by 3%, on average, while the rate of population growth plus inflation increased by about 3% from 2016 to 2023. This means that policymakers have done a better job budgeting in the last several years but there is more room for improvement. Additionally, these budget numbers are only the enacted budgets, not total state spending. Unfortunately, Alaska has a history of relying heavily on supplemental spending, which is above and beyond the enacted budget. From FY 2004 to FY 2023, the budget grew on an average annual basis by 5.2%, which was substantially higher than the average 3% rate of population growth plus inflation. Figure 3 illustrates state funds appropriations over this period and the appropriations that would have happened if they had followed the rate of population growth plus inflation each period. The budget growth excesses in the earlier period (2004-15) have compounded over time even with the improved budgeting since 2016 to lead a much larger budget over time. This results in state funds budgeted for FY 2023 $1.8 billion more than what would have been spent, which translates to the state spending an additional $2,500 per Alaskan. Or, if you take the cumulative differences between the actual budget and those if policymakers followed the rate of population growth plus inflation, the cumulative difference is $37.3 billion in overspending over time, which translates to excessive government spending of $50,000 per Alaskan. This excessive spending has resulted in a bloated state government that reduces private sector economic activity and opportunities for people to prosper.
Conclusion Alaska Policy Forum’s FY 2024 RAB sets a maximum budget threshold that will help bring the state budget in check with state appropriations of less than $7.71 billion, representing a 4.87% increase based on the rate of population growth plus inflation in 2022. Working to enact a budget less than this maximum amount, particularly considering the low revenue forecast, past budget excesses, and economic headwinds, will help immensely in reducing the cost of funding limited government. Policymakers should pass an FY 2024 budget that is less than the Responsible Alaska Budget and put this spending limit in the constitution. Doing so will move the Last Frontier into the future, with a strong, steady economy and a vibrant population with opportunities for all Alaskans to flourish. Originally published at Alaska Policy Forum. Texans are struggling with high property taxes, soaring prices, and stagnant income. As a result, most big-budget players favor some property tax relief. For instance, Gov. Greg Abbot declared his intention to use half of the actual surplus fund ($16.3 billion) for this initiative. Likewise, Lt. Gov. Dan Patrick revealed that property tax relief is his first legislative priority.
However, the economic outlook for 2023 is not encouraging. The IMF has announced a slowdown in the global economy, and a third of the world’s economy is expected to be in a recession in 2023. Moreover, the consensus among large financial institutions is that the U.S. will have a recession this year. Consequently, in such a bloomy scenario, caution is warranted on how to use Texas surplus funds prudently. Based on previous data, the Foundation finds that Texas has enough funds to use toward property tax relief, even in the worst-case scenario. Our three key findings are:
Considering that the State’s finances are robust enough to face a recession, the Foundation has proposed a path toward completely eliminating school districts’ maintenance and operations property taxes by using state surplus general revenue-related (GRR) funds to buy them down over time to zero. By following the spending limit of population plus inflation, assigning at least half of the current surplus and 90% of the future surplus thereafter, we should expect the elimination of school district M&O property taxes over the next decade. In case of any revenue shortfall, school districts could cover it with their reserve funds. By gradually replacing property taxes with more efficient sales taxes, more Texans would be able to boost their savings, afford a new home, and preserve their property while improving their ability to afford housing and other necessities. Originally published at TPPF. Payments on COVID disaster loans for small businesses are due, and it couldn't come at a worse time.
Roughly $390 billion went out to nearly four million small business owners during COVID lockdowns. "Those are starting to come due at the end of 2022 and early 2023, which could add to the financial pressure that a lot of small businesses are facing across the United States," says Vance Ginn, chief economist for the Pelican Institute for Public Policy. Ginn says many small business owners are still struggling to find and/or pay workers, on top of rising costs under Bidenflation. "Small businesses employ about 90 percent of all workers," he says. "This is really where you get the mass number of people working. If they start to pull back, it could lead to a rapid draw down in the number of jobs being created or that are even there now across the economy." At the same time, consumers are starting to pull back spending due to higher interest rates. "As inflation goes up, they don't have as much to spend on other goods and services. So, a lot of these small businesses are taking a hit at the same time they're going to start to pay back a lot of these loans," says Ginn. Originally aired on KTRH News in Houston, Texas. A Big Mac attack can now be satisfied with nearly no human contact, all from the comfort of the car.
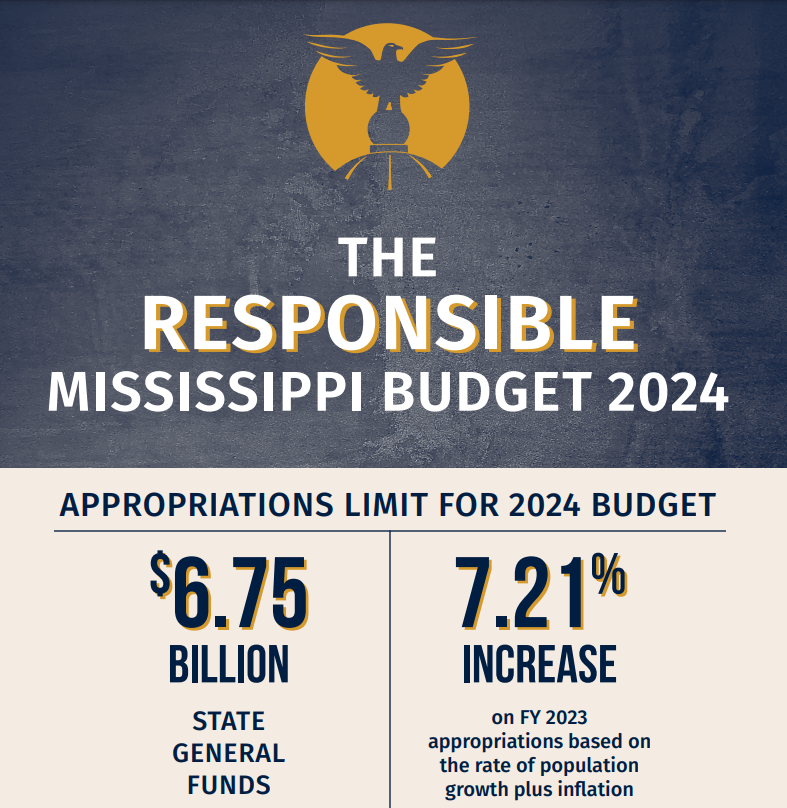
The largest fast food chain in the country, McDonald’s, is testing a highly automated location with no indoor seating just outside Fort Worth. It is the only location like this in the country. “The features – inside and outside – are geared toward customers who are planning to dine at home or on the go,” a McDonald’s press statement explained of the design. The restaurant at 8540 West Freeway in White Settlement has multiple modes for ordering and receiving the fare. A dedicated drive-through lane allows for ordering ahead and picking up burgers and drinks from a conveyor belt. An employee takes the order number and is available to answer questions throughout the process, a company spokesperson said. Order kiosks inside the location accept cash or credit, parking is available for curbside pick-up, and food couriers like GrubHub drivers have a dedicated area to streamline their interaction as well. According to the spokesperson for McDonald’s, customers appreciate the new technology and ease of ordering associated with the “Order Ahead Lane.” He also claimed delivery drivers appreciate the simplicity of an area just for them to pick up customers’ orders. Franchisee Keith Vanecek and Manager Rosemin Jussab are two of the people behind the operation of the new test restaurant. Jussab, who has worked for McDonald’s for 20 years since her college days, enjoys the challenge and the technology that comes along with it. “The focus on technology within this restaurant is amazing and shows the emphasis we put on innovation; it’s exciting to be a part of,” she said in a press release. For those concerned that an automated restaurant like this one will eliminate entry-level jobs, McDonald’s says it anticipates this restaurant format will require a comparable number of team members to a traditional store. Employees are required for interaction between customers and the restaurant team when picking up orders, assisting with using the self-order kiosks, and delivering curbside orders. The recent coronavirus pandemic likely contributed to the speed of automation we are seeing in industries like fast food restaurants today, economist Vance Ginn told The Texan. Ginn said the pandemic has led to difficulty finding workers, inflation has raised the wages demanded by entry-level workers, and high turnover rates have increased costs for training. Combined, these factors have contributed to an acceleration in the implementation of technology like the new test location of McDonald’s. “Businesses have to make a profit or they don’t stay in business,” Ginn noted. “Short-term [the automation] may have some costs, but other jobs will come around,” Ginn said. He suggested a shift to other jobs will take place as has always happened when technology advances and crowds out another industry. “When the Model T was created, people cried about the end of horses and buggies, but we wouldn’t want to go back,” he added. Additionally, entry level workers may be incentivized to get training in higher technical skills to participate in the workforce. McDonald’s is aiming to serve its customers more satisfactorily and seamlessly through the use of automation at its new test location. The chain has struggled with customer satisfaction, falling at the bottom of the list 15 points behind Chick-Fil-A, a perennial leader with employees declaring their “pleasure” in serving customers. Whether the newest test location will help McDonald’s move up in the satisfaction rankings, and whether it is adopted elsewhere, remains to be seen. “That’s the beauty of the free market,” Ginn commented. “Businesses can try new things and see if they are profitable. It allows for experimentation.” Originally published at The Texan. Here is The Responsible Mississippi Budget 2024 which I wrote for the Mississippi Center for Public Policy's President & CEO Douglas Carswell who wrote this to go along with the report. Mississippi recently made some significant tax cuts. Thanks to the 2022 Mississippi Tax Freedom Act, over a million Mississippi workers will be better off as the state income tax rate is reduced from around 7 percent to a flat 4 percent. In the coming legislative session, Mississippi lawmakers have to set a budget for 2024. Some will call for further tax cuts. Others will insist that we cannot afford tax cuts. What should conservative lawmakers do? To help authentic conservatives in our state, the Mississippi Center for Public Policy has published a responsible budget for our state. The key to setting a responsible budget, as every householder knows, is to get control of what we spend. We believe that Mississippi’s government spending (general fund appropriations) for 2024 should not exceed $6.75 billion. To increase spending over and above that amount would mean raising spending per person in our state faster than inflation. That would be un-conservative. When setting a budget, conservatives that are serious about limiting the size of government ought to follow a simple fiscal rule; any increase in government spending should not exceed the rate of population growth plus inflation. Before drafting our budget, we took a look at Mississippi government spending over the past decade or so. Unfortunately over the past decade state government spending (the general fund appropriations) has tended to grow rather rapidly. Between 2014 and 2019, state government spending grew faster than population change plus inflation, meaning that the relative size of the state government in Mississippi increased. The good news, however, is that since 2020 the expansion of the state government in Mississippi has slowed. Spending growth over the past three years has not exceeded changes in population plus inflation. Genuinely conservative lawmakers should aim to keep things that way in 2024, and not exceed $6.75 billion in spending. If lawmakers set a responsible budget that keeps control of spending, we estimate that there will be a budget surplus of around 800 million in 2024 – a portion of which could be used to reduce the tax burden yet further. During the last legislative session, a number of lawmakers argued that we could not afford to cut taxes. If we were not careful, they claimed, we could end up like Kansas. Kansas did indeed once cut taxes, before having to raise them again when the money ran out. But the money only ran out in Kansas because they failed to get control of spending first. Here in Mississippi, provided we limit the general fund appropriation to $6.75 billion, there will be not just a surplus, but a sustainable surplus that can be used to cut taxes. We believe that Mississippi’s budget surplus is both cyclical and structural. That is to say the surplus will not simply disappear as and when the economy slows. Provided Mississippi lawmakers keep spending under control there will be money left over to reduce taxes. Over the past few decades, the southern United States has flourished. Tennessee, Texas, Georgia and Florida have enjoyed rapid growth. Dallas and Nashville have become go-to places for ambitious young people right across America. Why are these southern states doing so well? Because they tend to be run by people who appreciate the importance of low taxes and light regulation. While those that run New York, Chicago and California have raised taxes and red tape, driving businesses away, the south has gone in a very different direction. Mississippi could be part of this southern success story too – provided we continue to cut taxes. A responsible budget for 2024 that carefully controls spending would be another big step in the right direction. Douglas Carswell is the President & CEO of the Mississippi Center for Public Policy. The Responsible Budget for Mississippi can be read HERE. A 2022 Pew Research Center survey found that an alarming number of people still believe that socialism “gives all people an equal opportunity to be successful,” with 52% agreeing this statement is at least somewhat true for socialism.
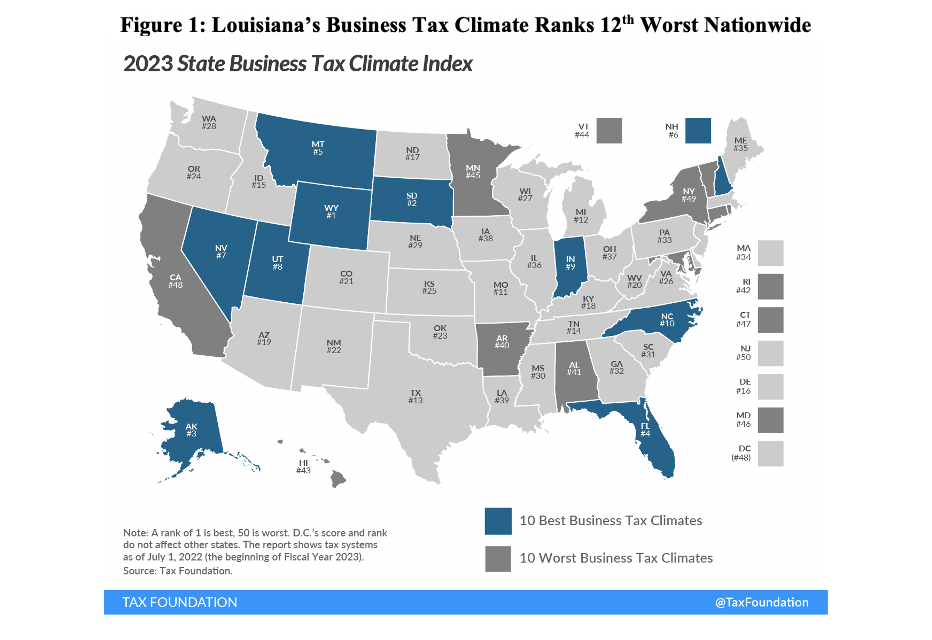
Fortunately, 64% agreed that statement is at least somewhat true for capitalism. Still, it is evident that most people who favor socialism don’t understand it or its negative consequences. Apologists for socialism need to understand what the late economist Friedrich Hayek said: “There is all the difference in the world between treating people equally and attempting to make them equal. While the first is the condition of a free society, the second means, as de Tocqueville describes it, a new form of servitude.” Socialist economies surrender class distinction by giving up freedom to politicians in the marketplace, including work, education, healthcare, and more. This is the exact opposite of “free.” Nothing scarce is free because there are trade-offs that come with every decision. Nations with socialized labor, schooling, and medicine must fund them at the expense of taxpayers, from the lost productivity that results from less economic growth, and from the lost opportunities with each of those taken dollars. People in socialist economies work under a glass ceiling that they can never break. They surrender so much of their resources to the government that it contributes to a forced mediocrity. But in capitalist economies, the ceiling is much higher. People have more potential to prosper because the means of capital and labor are owned by them personally, not by politicians. Greater economic freedom under capitalism tends to yield higher life expectancies, higher incomes, greater per capita GDP, and less poverty when considering countries or states . But when the government is empowered instead of its citizens, people are left with few options for innovative solutions in the private sector. This destroys organic competition, where the best solution can be the most successful. This bears out the experience of socialist economies, that the government institutions dominating the provision of services typically have low quality at high cost. Some socialists claim that their preferred system of pooling resources for everyone is a superior way of helping people than philanthropy or the work of employers, churches, or charities. But this assumes that a one-size-fits-all approach will work for everyone. In reality, each person is different with unique needs, which is why making ways for entrepreneurs to create new solutions is critical. A system run by politicians can never fully satisfy the needs of its people. It makes winners of the politically connected and losers of everyone else. One reason that people, especially young adults, may find socialism appealing is because it appears compassionate on its surface. A paradise where everyone is clothed, fed, and happy sounds like something to desire. But that’s never the outcome when liberties are surrendered to leaders. The lack of belief in free markets is really the lack of belief in free people. Too many on the Left and the Right fail to understand this fact with their big-government solutions. The world is witnessing this reality unfold in real time in the once-thriving nation of Cuba . Cubans embraced socialism 60 years ago with high hopes and are now impoverished and starving, waiting in line for hours with hopes of getting some bread , while politicians spend their money on sports teams and hotels to impress outsiders. By its nature, socialism disempowers people and forces them down the road to serfdom. Capitalism, with a free market economy of voluntary exchange and limited government, allows spontaneous order with a well-functioning price system to best allocate resources to those who value it most. This results in a compassionate system for people rather than for politicians. Socialism hasn’t worked, other than to impoverish many people across the globe. Stop its expansion and instead return to the antidote: free market capitalism. Originally published at Washington Examiner. In October, the Tax Foundation released the 2023 State Business Tax Climate Index. The report ranks all fifty states based on the collective burdens of each state’s corporate income tax, individual income tax, sales tax, unemployment insurance, and property tax. The results showed that spending restraint funded with a low rate, broad-based taxes provide the best climate for business activity, which supports more jobs, and we all know that work helps provide people with dignity, purpose, and hope, along with the long-term self-sufficiency that is essential for families to flourish. The Tax Foundation’s report notes what many entrepreneurs in Louisiana already know: the state’s business tax climate needs improving. Figure 1 shows that last year the state ranked as the 12th worst among the 50 states, which is an improvement from the 8th worst ranking in the prior year, but still well below where it needs to be to support more in-migration, economic growth, and well-paying jobs. Last year’s ranking was influenced by the corporate tax rank of 32nd, individual income tax rank of 25th, sales tax rank of 48th, property tax rank of 23rd, and unemployment insurance tax rank of 6th in the nation. Source: Tax Foundation
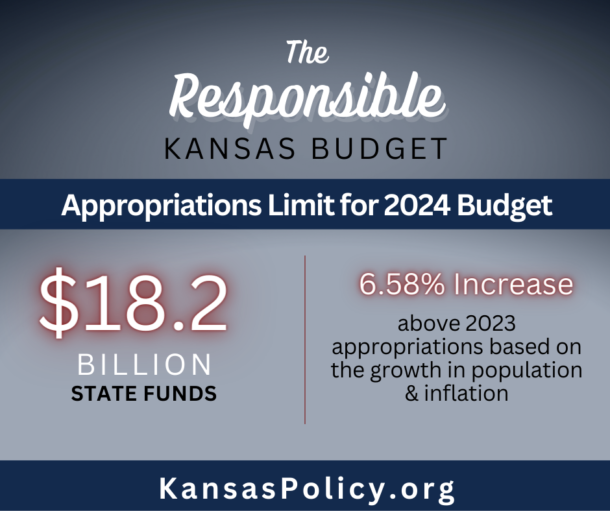
Compared with nearby states, Louisiana ranked ahead of Arkansas (40th), behind Mississippi (30th), and remained well-below neighboring Texas which improved from the previous report to 13th best in the nation. Given the upcoming 2023 session in Louisiana, the state legislature has an extraordinary opportunity to learn from the Tax Foundation’s report on how to improve. For Louisiana to provide greater opportunity for entrepreneurs and families to prosper, the business tax climate must improve by limiting spending, reforming and cutting taxes, and reducing regulatory burdens. Doing so will help more Louisianans live the American Dream. Originally published at Pelican Institute. Last year, Kansas Policy Institute released its first edition of the Responsible Kansas Budget (RKB) for 2023. This model for accountable, sustainable budgeting proposed a limit on All Funds (state funds plus federal funds) appropriations in 2023 at $21.0 billion based on limiting spending increases to the combined rate of population growth and inflation. Instead, the Legislature approved an All Funds budget of $22.9 billion – nearly $2 billion more than the RKB. While the RKB is determined by previous years of appropriations, it isn’t a justification for that spending – and in fact, there was likely waste or things that could have been approved previously. This year, the RKB returns, but with a new focus on State Funds instead of All Funds. This is because State Funds more accurately represent the spending under the direct control of Kansas’s government. for 2005 to 2023, state funds appropriations have increased by 138.1%, from $7.2 billion to $17.1 billion, for an average annual increase of 5.2%. The 2024 Responsible Kansas Budget (RKB) sets a maximum threshold on the State Funds budget based on the rate of population growth and inflation during the prior year before a legislative session. This is a simple calculation of finding the growth rate of the state’s resident population and adding it to the growth rate of the US chained-CPI. In 2021, the US chained-CPI inflation increased 7.18%, and Kansas’s population growth declined 0.60%. The sum of these values, an increase of 6.58%, serves as the maximum growth rate for SGF appropriations in 2024. With a base approved State Funds budget of $17.1 billion in 2023, the 2024 RKB is a maximum of $18.21 billion. Efficiency is key to hitting the RKB’s limits: there’s potential everywhere in government to reduce costs while still providing the same service. One tool to do this is performance-based budgeting, a review system in which each program submits goals and outcome measures related to how well they are succeeding in those goals. Kansas has performance-based budgeting, yet the first report released in December 2021 was half-hearted, difficult to interpolate from, and indicative of hundreds of millions of dollars going to programs with little accountability. A KPI report on performance-based budgeting will be released Thursday of this week. 2022 showed how unpredictable the economy could be, with inflation harming thousands of families across the state. Many of the issues driving inflation are out of the hands of Kansas legislators. And yet, government spending is directly in the hands of our elected officials and could be a small way to help families currently feeling the squeeze of inflation. Responsible budgeting is a way that local leadership can shore up their governments and economies to withstand downturns. Low spending means low taxation and lower regulation, which gives people and businesses more room to flourish. View the 2024 Responsible Kansas Budget in our report below. Originally published at Kansas Policy Institute. |
Vance Ginn, Ph.D.
|













 RSS Feed