|
Originally published by American Energy Institute.
0 Comments
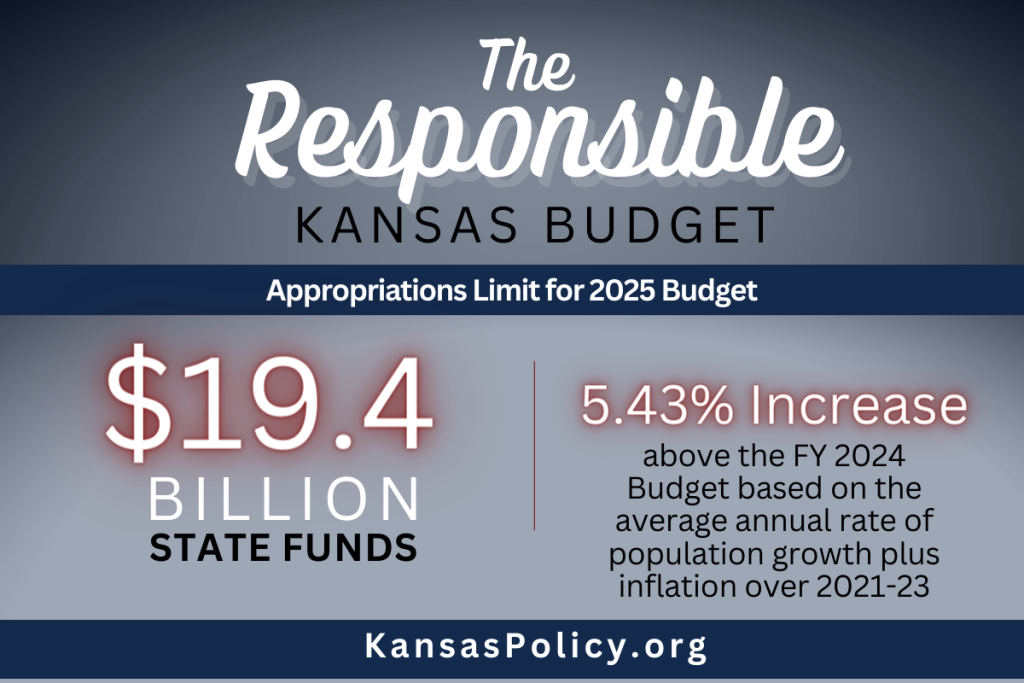
Originally published at Texans for Fiscal Responsibility.  Executive Summary
 Originally published at Kansas Policy Institute. Kansas, like most states, has a spending problem, not a revenue problem. The 2025 Responsible Kansas Budget offers several ways that the state can limit its spending to pave the way for tax reform and economic growth in the future. In June 2023, Kansas ended FY 2023 with collected tax revenues at $10.2 billion – a 4.1% or $402 million increase over the collected tax revenues of FY 2022. According to the Kansas Legislative Research Department, even if Kansas had enacted a flat tax bill during its 2023 legislative session, the state would end FY 2028 with $2.7 billion in its ending balance and $1.8 billion in the Budget Stabilization Fund, totaling $4.5 billion in reserves. At the same time, spending has grown massively over the last decade. According to the FY 2025 Governor’s Budget Report, the approved FY 2024 General Fund budget of $9.918 billion is 13.6% more than the approved 2023 budget. In FY 2020, the State Fund appropriations equaled $12.6 billion, but has ballooned into and after the COVID-19 pandemic to be $19 billion in FY 2023 and a base of $18.4 billion for FY 2024. If Kansas’s annual appropriations had grown at the rate of population growth plus inflation since FY 2005, State Fund appropriations would be $6.4 billion lower in FY 2024 than the actual base appropriations. This equates to a $46.6 billion cumulative difference from FY 2005 to FY 2024. What this number represents is higher taxes on Kansans, slower economic growth, and fewer opportunities for people to flourish. Originally published at Pelican Institute. The report to achieve Louisiana’s 2024-2025 Responsible Budget presents solutions to rein in the extraordinary growth of the budget in order to give the state a competitive advantage, much like those used in other states, such as Texas and Florida, limiting the amount of funding appropriated at the beginning of each fiscal year. Over the past decade, state spending has increased an average of 5.9% per year. Using the recommended Responsible Budget growth limit outlined in this report, state spending would have increased by only 2.1% per year, which would allow the excess state revenue to be saved for tax relief for Louisiana families.  Originally published at Texans for Fiscal Responsibility. 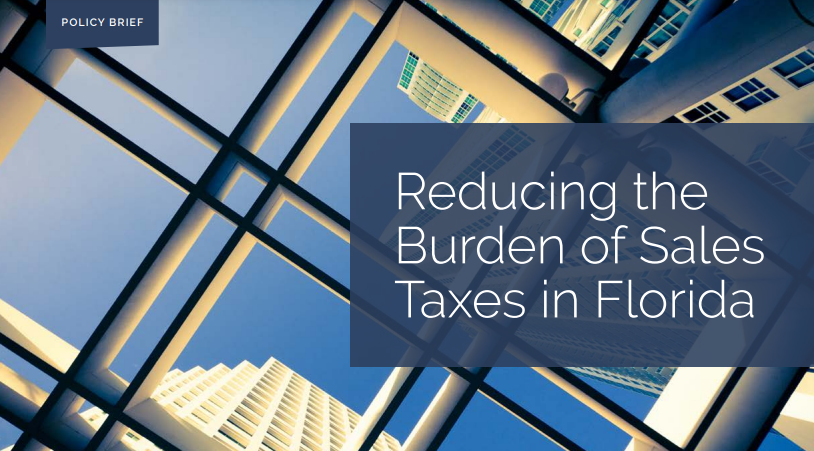 Originally published at James Madison Institute. Florida is an economic leader because it has produced pro-growth policies of lower government spending, taxes, and regulations for years. This strong institutional framework must continue. A new report, “Reducing the Burden of Sales Taxes in Florida,” authored by The James Madison Institute (JMI) Senior Vice President Sal Nuzzo and JMI Senior Fellow Vance Ginn, Ph.D., outlines recommendations for ways in which Florida lawmakers can reduce the government burden on citizens and businesses. “Florida continues to be the best place to start and grow a business. That requires us to continually examine ways to make it more attractive as states become more and more competitive. One way our policymakers and governor can do this is by addressing the sales tax allowance, which currently places us at a competitive disadvantage when looking at other states, especially within our region. By making this allowance more reflective of how much compliance truly costs, we can ensure that the principles of limited government and economic liberty advance.” — Sal Nuzzo, Senior Vice President, The James Madison Institute “Florida has been a key model for the country with a sound approach to conservative fiscal policy. This includes the commitment to a conservative state budget, no personal income tax, minimal corporate welfare, and sensible regulation. To retain the title of “Free State of Florida” and provide more opportunities that let people prosper, policymakers should continue championing policies that spend, tax, and regulate less so families and entrepreneurs can reach their full potential. Reducing the burden of collecting sales taxes on entrepreneurs by at least doubling the sales tax allowance and streamlining the collection process to reduce compliance costs will help achieve this goal while providing lower prices to families.” — Vance Ginn, Ph.D., Senior Fellow, The James Madison Institute Originally posted at South Carolina Policy Council. Thanks to a robust state economy, plentiful business opportunities, and a relatively low cost of living, South Carolina remains one of the fastest-growing states in the nation. To maintain this strong position and promote further growth, it is crucial for S.C. legislators to limit state spending and reduce the government’s burden on taxpayers. The S.C. Policy Council created the South Carolina Sustainable Budget (SCSB) to assist in this effort. The SCSB is a maximum limit on annual recurring general funds[1] appropriations based on the rate of state population growth plus inflation. First published in 2022 and again in early 2023, it has served as a data-driven resource to help rein in unsustainable spending and provide more opportunities for tax relief. Unfortunately, the state did not adhere to the SCSB limit of $11.20 billion for its fiscal year (FY) 2024 budget; instead, it appropriated $11.64 billion – a 12.56% increase above the FY23 base of $10.34 billion. To turn the tide of excessive budget growth and provide more room for tax relief, the Policy Council is issuing its third SCSB. Table 1 provides the results outlined in this report for the FY25 SCSB. Table 1. The FY25 South Carolina Sustainable Budget for Appropriations of Recurring General Funds 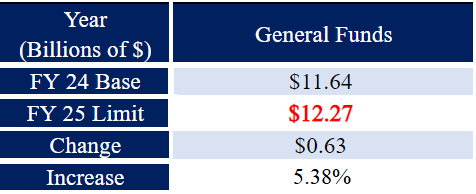 Based on population and inflation data in 2023, the recommended recurring general funds appropriations limit[2] for South Carolina’s FY25 budget is $12.27 billion. With inflation moderating somewhat since reaching a 40-year high in 2022, primarily because of the errant policies in D.C., the SCSB ceiling is higher than it would be under normal economic circumstances. For example, the average annual rate of population growth plus inflation since 2013 has been 3.78%. Accordingly, the S.C. Legislature should consider freezing spending at the current FY24 budget of $11.64 billion. This would help correct recent overspending in the state’s budget and help put the state on a more sustainable budget path. It would also leave more money available for needed tax relief. At a minimum, recurring general fund appropriations in the FY25 budget must remain below $12.27 billion. Overview A sustainable budget – sometimes called a conservative or responsible budget – is a model for state budgeting that sets a maximum limit on appropriations or spending based on the rate of population growth plus inflation. This metric serves as an indicator of what the average taxpayer can afford to pay for government provisions. It accounts for 1) More people in the state who could potentially pay taxes; 2) Wage growth that’s typically tied to inflation over time to pay taxes; and 3) Economies of scale, as not every new person or wage increase should be associated with new government spending. The SCSB does not make specific recommendations on how general funds should be appropriated in the budget. Instead, it gives legislators the flexibility to appropriate taxpayer dollars to government programs as determined by the General Assembly, while ensuring that spending growth remains in line with what people can afford. Such a voluntary spending limit is key to putting South Carolina in a position for further tax relief. In 2022, Gov. Henry McMaster and lawmakers enacted the first-ever state personal income tax cut, which immediately reduced the top rate from 7% to 6.5% and collapsed the lower bracket to 3%. It also scheduled additional yearly 0.1% cuts to the top rate until it reaches 6%, though general fund revenues must project at least 5% annual growth for the cuts to trigger. The problem with this approach is that it relies on continued revenue growth to deliver incremental tax relief. Following the SCSB would help to accelerate this process, freeing up revenue to buy down the top rate to 6% immediately and fueling other tax cuts. On the other hand, unsustainable spending could build pressure to reverse course and raise taxes, leaving South Carolinians with fewer opportunities to flourish. SC Appropriations vs. Sustainable Budget Figure 1 compares the previous twelve years[3] of South Carolina’s recurring general fund budget appropriations (FY13 to FY24) to those appropriations when limited each year to the rate of population growth plus inflation. Figure 1. South Carolina General Fund Appropriations v. SCSB 12-year GF appropriations: $98.5 billion (+91.1%) 12-year GF appropriations limited to population growth + inflation: $86.5 billion (+50.0%) 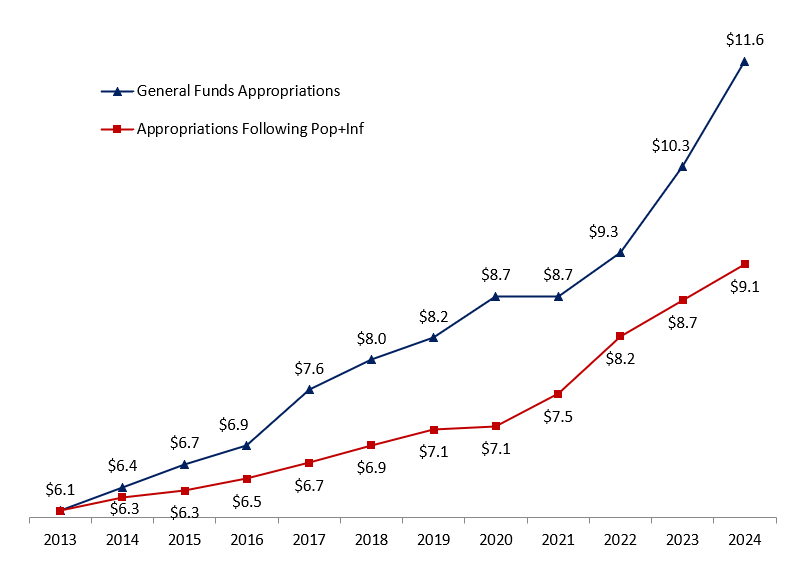 Notes. Budget amounts are based on data from South Carolina’s state budget publications, Fed FRED for state population growth and U.S. chained-CPI inflation, and authors’ calculations. Appropriations did not increase from FY20 to FY21 because the state operated on a continuing resolution in FY21.[4] Key takeaways (see Table 2):
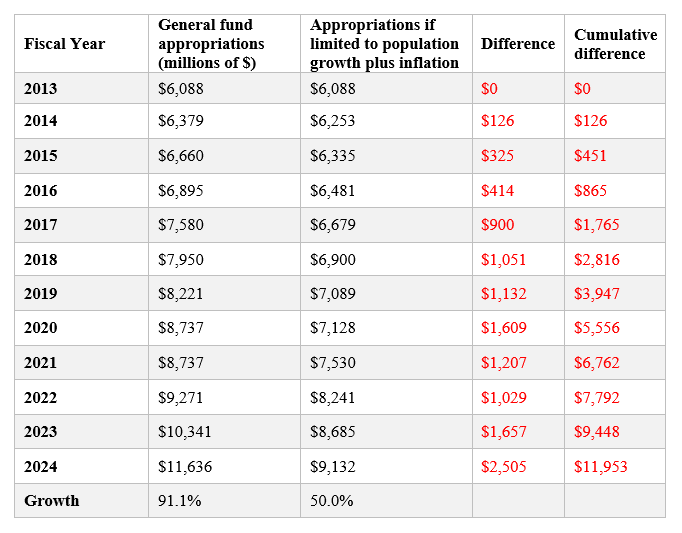 Note. Budget amounts are based on data from South Carolina’s state budget publications, Fed FRED for state population growth and U.S. chained-CPI inflation, and authors’ calculations. These data provide clear evidence that there is room for the state to limit spending growth to reduce taxes substantially. South Carolina has been one of the 25 states in the last three years to cut income taxes, which has helped the state improve compared to its neighbors. However, North Carolina recently passed legislation that could eventually bring their income tax rate to 2.49%, which would be the lowest in the country, excluding the seven states without personal income taxes. On that list are Florida and Tennessee, two major competitors for jobs and investment in the Southeast. South Carolina could improve its position by passing sustainable budgets and using the surplus revenue to cut taxes, especially income taxes. See Table A in the Appendix for more comparisons of South Carolina with other states. Follow the SC Sustainable Budget We strongly encourage legislators to follow the SCSB when drafting South Carolina’s FY25 budget. As a data-driven resource, the SCSB sets a clear spending limit based on what the average taxpayer can afford to pay for government services. Surpassing this limit will fuel excessive government growth and promote unsustainable spending, leaving less revenue that can be used to lower taxes. Recent budget projections show a historic opportunity for tax relief – if legislators are willing to take it. In its November 2023 forecast, the S.C. Board of Economic Advisors (BEA) estimates a recurring budget surplus of $673.1 million for FY25. It also projects the cost of lowering South Carolina’s top personal income tax rate from 6.4% to 6.3% to be roughly $100 million (which is accounted for by BEA prior to their $673.1 million projection). Based on current data, we estimate[1] it would cost an additional $300 million in revenue to cut the top rate immediately to 6% in the new budget. Accordingly, this all-at-once cut could be achieved using less than half of the projected recurring surplus. Passing a sustainable budget would be easier if state agencies followed South Carolina’s legal budget process. Under current law, agencies are supposed to justify every dollar they are requesting when submitting their annual budget plans to the governor – explaining why both new and current programs deserve taxpayers’ money. The law follows a concept known as zero-based budgeting, where all expenses need to be justified annually based on need and performance without regard to previous budgets. Despite this legal mandate, agencies only provide details for new spending requests each year. Fortunately, South Carolina is decently prepared for a rainy day should it occur. Voters in 2022 approved two amendments to increase contributions to the state reserve funds – raising the General Reserve Fund from 5% to 7% (over several years) and the Capital Reserve Fund from 2% to 3% of the previous year’s general fund revenue. By law, the reserve funds act primarily as a shield against year-end budget deficits. While these reserve funds are important to withstand volatility in the budget, lawmakers should focus on limiting or cutting the budget for it to be sustainable over time. Conclusion Following the SCSB will put South Carolina in a better position to reduce taxes, avoid the cost of excessive government growth, and give citizens more opportunities to flourish. Had this been done since 2013, the state could have substantially lowered personal income taxes, if not eliminated them. Fortunately, the upcoming budget provides state leaders with another crucial opportunity to rein in spending and deliver much-needed relief. South Carolina taxpayers are counting on it. Appendix: How Does South Carolina Compare with Other States? Table A shows how South Carolina compares with the largest four states in the country (i.e., California, Texas, Florida, New York) and neighboring states (i.e., Arkansas and Mississippi) based on measures of economic freedom, government largesse, and economic outcomes. Table A. Comparison of States for Measures of Economic Freedom and Outcomes 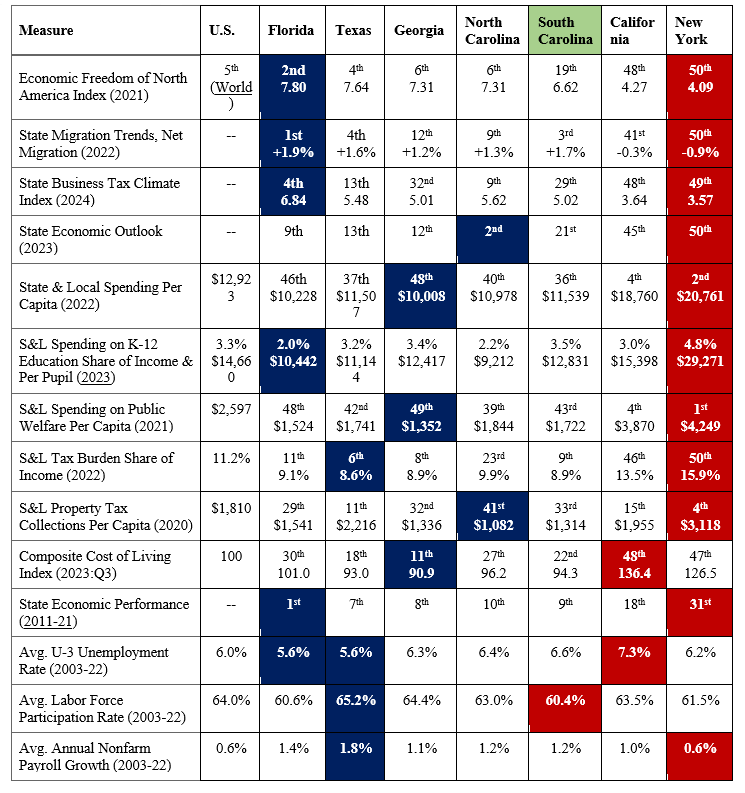 Notes. Dates in parentheses are for that year or the average of that period. Data shaded in blue indicate “best,” and in red indicate “worst” per category by state.
These rankings show that South Carolina is better than most states in terms of economic freedom, but is substantially less economically free than its neighbors of Georgia and North Carolina. South Carolina does better than others in this comparison in terms of having the lowest supplemental poverty rate and near the best in net migration. South Carolina has the highest state and local government spending per capita among its neighbors and a substantially worse business tax climate than North Carolina. The data show that states with less economic freedom (e.g., New York, California, and South Carolina) tend to perform economically worse. On the other hand, those states with more economic freedom (e.g., Florida, Texas, Georgia, and North Carolina) tend to perform economically better. Given these comparisons, South Carolina has much room for improvement to be more competitive and, more importantly, provide more opportunities for human flourishing.  Originally published at Independence Institute. In 1992, Colorado voters adopted the Taxpayer’s Bill of Rights (TABOR) to limit the growth in state and local spending. Over the past three decades, however, politicians from both parties and a complicit judicial branch have exempted more and more state spending from the TABOR limit. When voters adopted TABOR, 67% of state spending was subject to the limit. Today, the majority of state spending is not subject to the limit. Consequently, state spending has far outpaced Coloradans’ incomes over the last decade. To uphold the original intent of voters when they adopted TABOR, Independence Institute proposes the Sustainable Colorado Budget (SCB), which limits state spending from state funds (excluding federal funds) at the rate of population growth plus inflation. The state should then use the surplus revenue above the SCB spending limit to reduce the income tax rate for all taxpayers. Read the full paper here. Here's the original post by the Pelican Institute. Pelican Institute reform plan would flatten personal and corporate taxes, boost jobs in first year. Baton Rouge — As candidates for Louisiana governor debate the future of the state, a new poll shows Louisiana voters strongly support phasing out the state’s income tax while ushering in fiscal responsibility. Today, the Pelican Institute has released a new tax reform plan that would do just that—transform the state, make it more competitive, pave the way for more and better jobs, and launch Louisiana’s comeback. By a wide margin, 58% of Louisiana voters support phasing out the state income tax (only 20% oppose), and 66% want leaders to prioritize responsible budgeting and limiting the growth of state spending to bring fiscal stability to state government (only 9% oppose). Voters also strongly back education freedom; 62% support giving Louisiana parents the ability to use state funds to select the school of their choice for their child’s education (only 25% oppose). The poll, which was conducted by Cor Strategies in partnership with the Pelican Institute, can be seen here. In Louisiana’s Comeback: A Tax Reform for Our Brighter Future, the Pelican Institute identifies the state’s significant tax problems and proposes a path to set the state in a brighter direction, including flattening the personal and corporate income taxes to 3.5% rates, reducing the number of tax preferences, eliminating the corporate franchise tax and the inventory tax, and reforming the budget to limit the growth of spending, among other changes. “If we are to write Louisiana’s comeback story, we first have to get our fiscal house in order and fix our broken tax code that has, for far too long, landed Louisiana at the bottom of every good list and the top of every bad list,” said Daniel Erspamer, Chief Executive Officer of the Pelican Institute. “Louisiana families are suffering, and too many of our best and brightest are leaving the state to find opportunity elsewhere. It’s time to embrace a bold vision for tax reform proven to bring jobs and opportunity – not to mention our kids and grandkids – back to our state.” Louisiana suffers under a tax system that is brutally punishing for families and businesses. It is painfully progressive, thereby increasing tax rates as more income is earned—and that disincentivizes greater earnings, reduces productivity, and slows economic growth. Meanwhile, tax preferences create exemptions and deductions that make compliance costly, pick winners and losers, and narrow the tax base. That, in turn, requires an even higher tax rate to collect needed revenue for funding limited government. On top of that, Louisiana’s taxes on businesses are particularly burdensome, including a triple taxation on profit, investment, and inventory, that together stifle economic growth. The Pelican Institute’s tax plan solves these problems with a proposal that will kickstart the economy into immediate growth and increase the number of available jobs in the state in the first year. The plan is the latest part of the Pelican Institute’s Comeback Agenda released in March of this year, which lays out a series of policies critical to the state’s future, including tax and budget reform, guaranteeing universal education freedom, enhancing public safety, and reducing regulatory barriers to work. A two-page guide to the reform can be read below and a one-pager below that. Overview
Debt A recent report by the Texas Bond Review Board notes that Texas’ total outstanding local government debt is $280 billion, resulting in debt per capita of $8,869. This puts Texas’ local debt per capita in third place of the largest 10 states, behind only New York ($10,788) and California ($9,621), and nearly twice as high as in Florida ($4,753) (Figure 1). 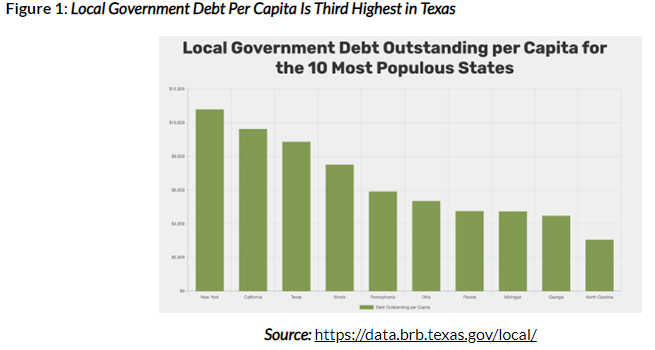 The following figures show the Texas Comptroller’s data for nominal and real (inflation-adjusted) outstanding general obligation (GO) debt for four of the largest cities in Texas (Austin, Dallas, Houston, and San Antonio). Each of them shows increased GO debt per capita from 2011 to 2020 in nominal and real amounts. But these amounts per capita show some differences. 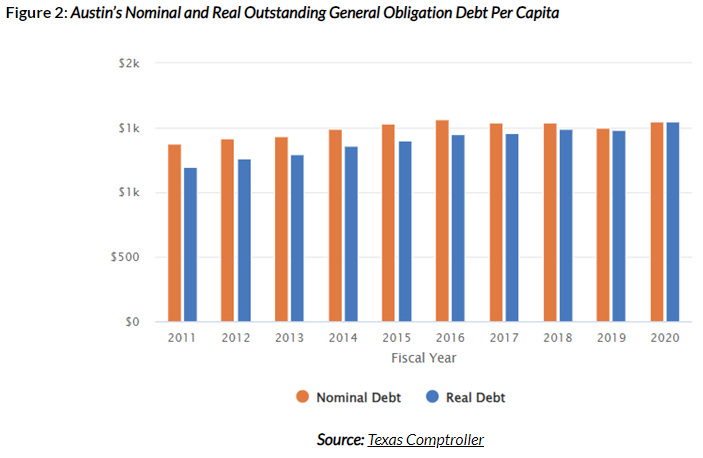 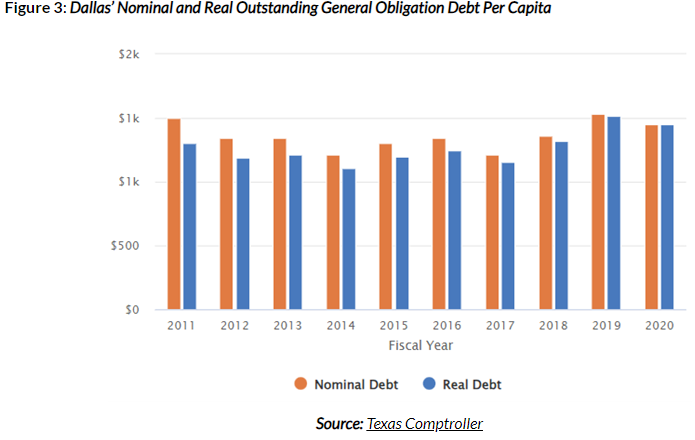 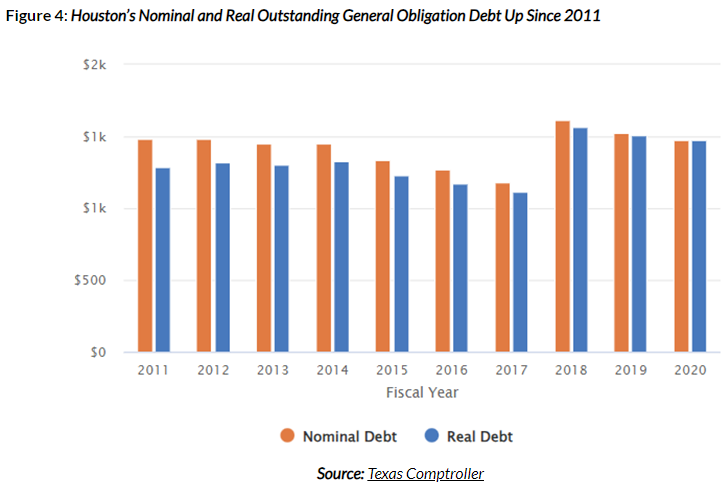 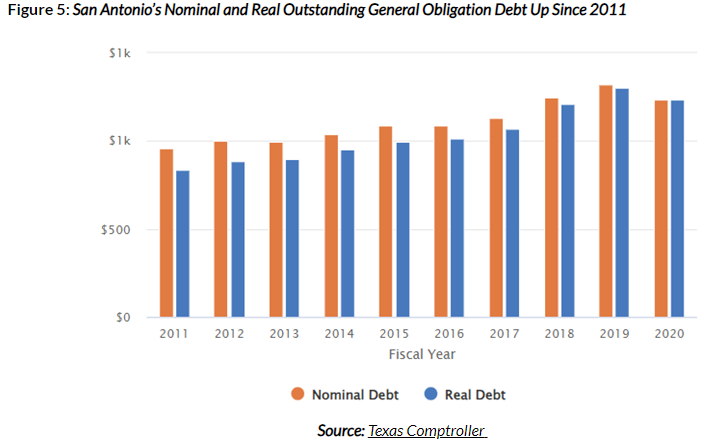
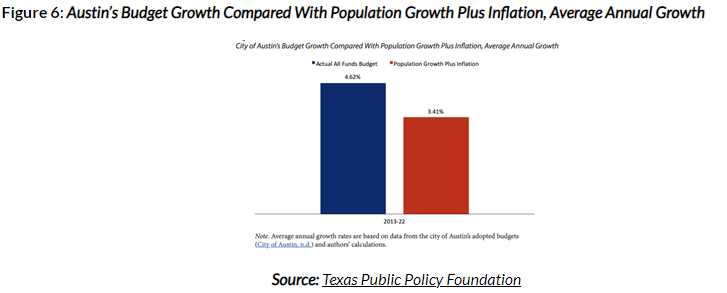
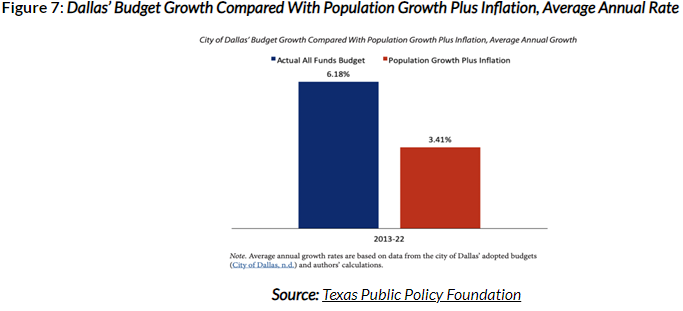
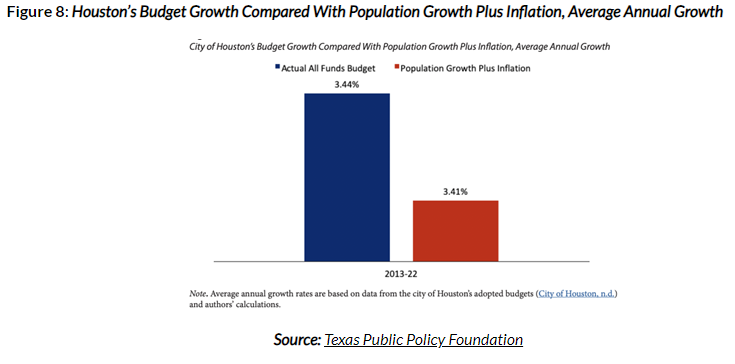
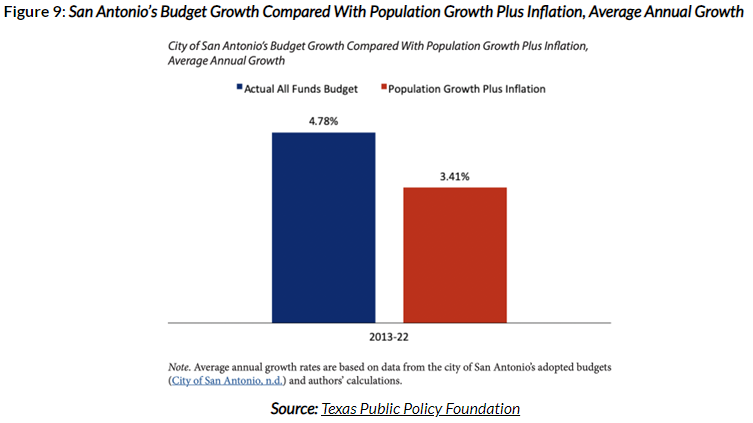
The unsustainable deficit accumulation across many of Texas’ local governments reflects irresponsible spending. Economist Michael Munger called this “Deficits Are Future Taxes” (DAFT), meaning, increased debt signals a current spending issue and a future taxation problem for the next generations. This is a significant challenge for the state’s future and drives up property taxes higher than otherwise. Spending My analysis in June 2022 found that Texas’ four major cities have exceeded a responsible city budget for years, contributing to higher taxes and debt. This responsible budget sets a maximum threshold based on the average taxpayer’s ability to pay for it, which is best represented by a fiscal rule of a spending limit with the rate of population growth plus inflation. Of course, this growth is a maximum as the budget really should be frozen or even cut for most governments given their spending excesses over time. Truth in Accounting defines the local taxpayer burden as “the approximate dollar amount that would be required of each taxpayer in order to pay off all of a government’s liabilities today. It is calculated by dividing the ‘money needed to pay bills’ by the estimated number of taxpayers in the state or city,” demonstrating the depth of debt.
 When local governments want to spend more given their balanced budget requirements, they must raise taxes, and they primarily raise property taxes. Tax Revenue The Texas Comptroller reports that property taxes are the biggest revenue source for local governments. Here are the current total property tax rates for these large cities:
According to the Tax Foundation, Texas currently has the sixth-highest property tax burden on those with a home in the country (Figure 10) 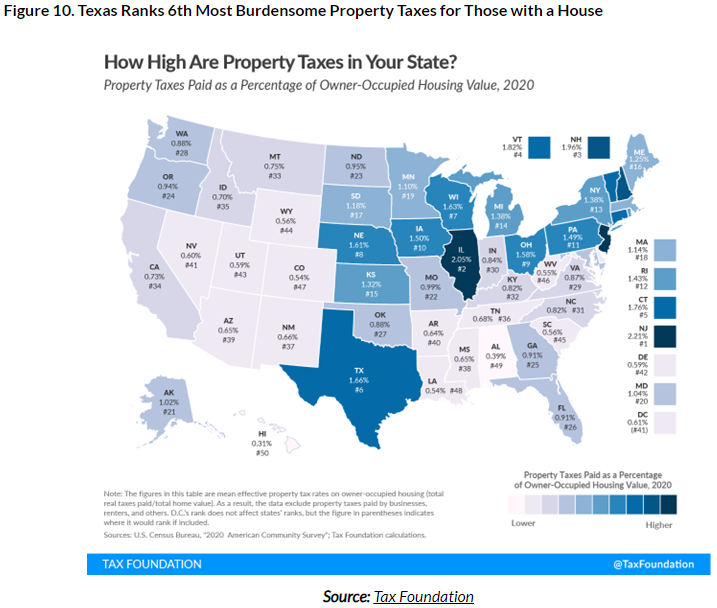 Although the Lone Star State has no income tax, its substantial property tax burden increases because of excessive local government spending increases in recent decades has burdened renters and holders of a home, reducing the state’s affordability. The Tax Foundation’s state business tax climate ranks Texas 38th out of 50 for the burden of property taxes. The Texas Legislature recently passed and Governor Greg Abbott signed Senate Bill 2 with $12.7 billion in property tax relief. This package includes reducing the school district maintenance and operations (M&O) property taxes by 10.7 cents per $100 valuation. It also includes raising the homestead exemption for school district property taxes by $60,000 to $100,000. However, this package should have been much larger, as there were $33 billion in surplus funds available and tens of billions of dollars more available, leaving plenty of taxpayer money to return. The property tax bills provided further complicate the tax system and will not result in as much relief as some are advertising. The best approach was to reduce school district M&O property tax rates with all the relief provided. This should have been at least $21 billion for a reduction of 25 cents per $100 valuation. This would have provided the largest property tax cut in Texas history (Figure 11) instead of the second largest because of the largest spending increase in the state’s history. 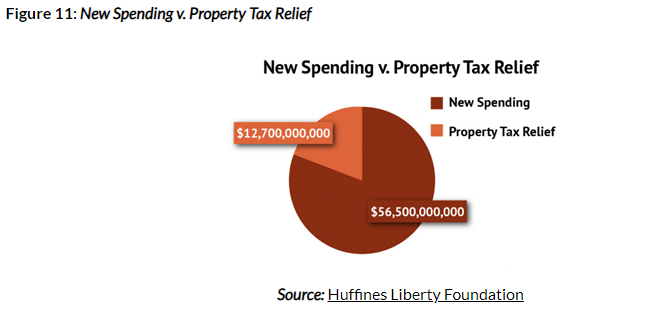 Recommendations
For the state to stay competitive and improve the future for Texans, Texas should seek to reform the largest hindrances to its economic flourishing: government spending and property taxes.
Conclusion The ultimate burden of government is not how much it taxes, but how much it spends. This is true at the national, state, and local levels. Texas boasts many metrics of economic freedom, including no personal income taxes, less burdensome regulations, and relatively less government spending. Recent increases in these areas hinder opportunities to prosper. Immediate policy changes to state and local budgeting that will eliminate property taxes, increase transparency for budgets, debts, and taxes, and strengthen their fiscal situation will help Texas better support prosperity for Texans today and for generations to come. Moreover, this will finally give Texans their God-given right to own property instead of renting from the government forever. Stop renting, start owning! Originally published with links to all sources at Texans for Fiscal Responsibility. dEverything old is new again, and that’s turning out to be true in the case of a growing drumbeat to use antitrust tools to rein in big technology companies like Apple, Amazon, Meta, and Google. But as a new policy report from the Pelican Institute points out, expanding the enforcement powers of antitrust agencies will do more harm than good—and an existing approach to protect consumers and producers, while encouraging innovation, is the better path forward. In their report “Antitrust & Enforcement: Letting Markets Work without Empowering Government,” Ted Bolema, Ph.D., J.D., Antitrust and Competition Fellow at the Innovators Network Foundation, and Vance Ginn, Ph.D., Chief Economist at the Pelican Institute, write that while the current frustrations with the size of large tech companies and censorship practices may be warranted, giving government enforcers and bureaucrats more power is not the answer. Instead, existing antitrust laws and the consumer welfare standard are still the best tools for protecting competition and consumers. “For the last 50 years or so, scholars and courts have operated with a consensus about the goal of antitrust enforcement: the consumer welfare standard, which asks, ‘does the conduct in question make consumers better or worse off?’” Bolema and Ginn write. “Antitrust enforcement based on the consumer welfare standard protects one of the most important outcomes of the competitive market process and is worth preserving.” Bolema and Ginn also note that calls to create new antitrust tools in response to conduct by “Big Tech” are misguided and will do far more to empower politicians and government bureaucrats than to prevent abusive conduct by technology companies. “Expanding the enforcement powers of antitrust agencies — as many on the left and some on the right now wish to do — harkens back to an older ‘big is bad’ approach,” they write. “Rather than promoting competition, such a retrograde approach undercuts the competitive market process which provides more innovation, cheaper prices, and better-quality goods and services necessary for continued human flourishing.” Bolema and Ginn say that the consumer welfare standard—and putting power in the hands of consumers and producers— is the tried and true path to ensuring their best interests. “As history has proven, empowering people in the marketplace rather than bureaucrats in government results in more efficient and effective outcomes and better supports liberty and prosperity,” Bolema and Ginn conclude. You can read the full report, “Antitrust & Enforcement: Letting Markets Work without Empowering Government,” here. Originally published by Pelican Institute. Overview
Texas Passes Largest Budget Increase in Texas History Texas Governor Greg Abbott (R) recently signed the Texas budget (HB 1) passed by the 88th Texas Legislature with the largest spending increases, the largest corporate welfare increases, and the largest social safety net increases—without the largest property tax cuts—in Texas history. State officials can claim that the budget increases by less than the rate population growth and inflation using the data in Table 1 by the Legislative Budget Board. 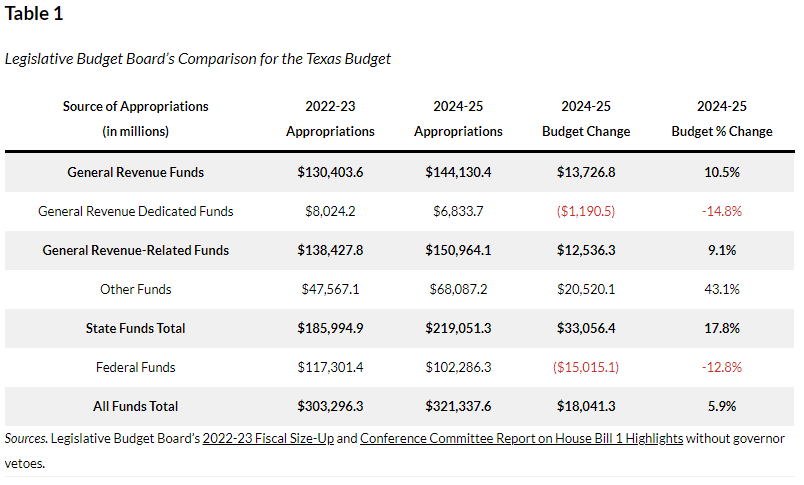 But those calculations use fuzzy math, as they’re based on inflating the 2022-23 base budget of general revenue not dedicated by the Constitution and consolidated general revenue with more spending, then increasing it by the rate of population growth times inflation of 12.33% (determined by the average of population growth times inflation over the last two years and the upcoming two years). Compare this with 2024-25 appropriations, which will be higher later when the supplemental bill passes. These calculations are then spending-to-appropriations, which is like comparing apples with oranges. Even with these calculations, the Legislative Budget Board shows in Table 2 that there is $10.7 billion in tax revenue remaining, $1.6 billion available under the constitutional spending limit using general revenue not dedicated by the Constitution, and $11.8 billion available under the 2021 spending limit with consolidate general revenue using general revenue and dedicated general revenue. 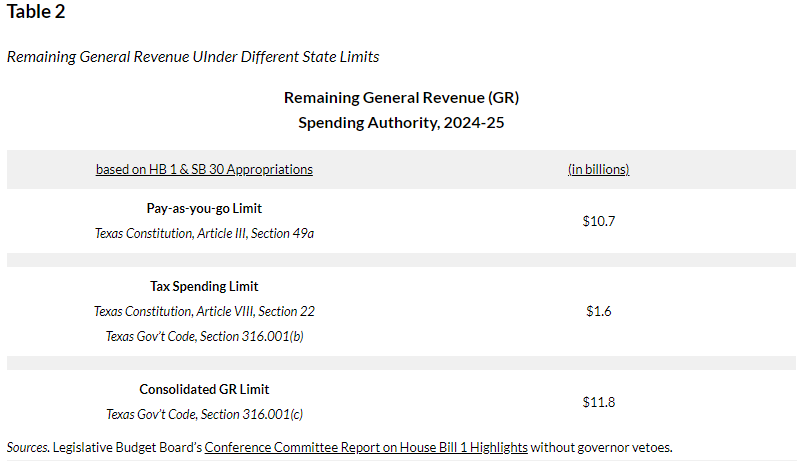 While the data in Table 1 provides an apples-to-apples budget comparison, the charts below are more accurate ways to evaluate the budget growth from an appropriations-to-appropriations approach. Better Comparisons for Budget Growth Understanding that any growth in the budget means an expansion of government, there are two strong arguments for limiting government spending: 1) Table 3 shows data for freezing the budget in inflation-adjusted per capita terms using the rate of population growth plus inflation (i.e., Conservative Texas Budget and responsible budget approach in other states), which was 16% over the last two fiscal years. This approach is appropriate as it grows slower than the economy over time. It also excludes $13.3 billion in COVID-related funding in the first biennium as well as new and old tax relief amounts of $6.2 billion ($100 million in new relief) in the first period and $18 billion (i.e., amounts passed in HB 1 of $5.2 billion for old relief and the latest of $12.7 billion in new relief during the second special session). Excluding these helps to not include one-time federal funding and amounts that don’t grow government. 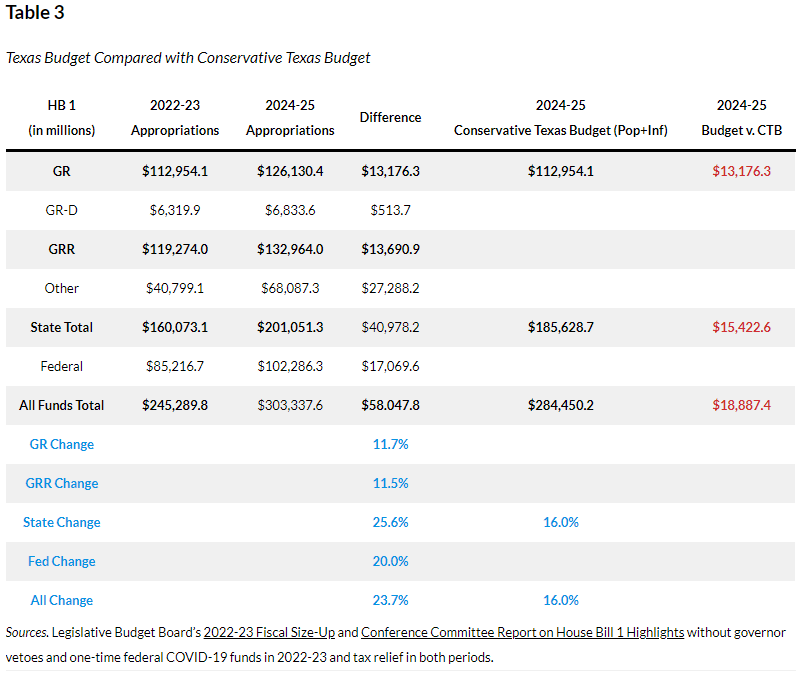 Using the CTB approach above, Table 4 highlights how the budget has improved since implementation of the CTB started with the 2016-17 budget. This looked much better before the current 2024-25 budget, but the massive growth of the current budget raised the growth of initial appropriations even as the rate of population growth plus inflation rose slightly during the latter five-budget period. If the growth of the budget is not controlled, it will soon surpass the rate of population growth plus inflation like it did during the prior six budget periods. 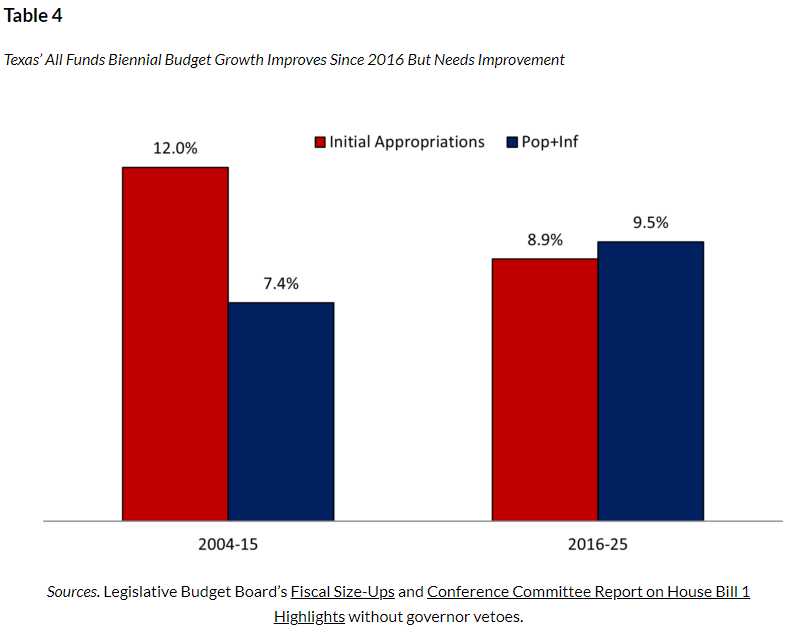 2) Table 5 shows freezing the budget with zero growth as the budget is already too big (i.e., Frozen Budget), including COVID-related funds in the first period and new and old property tax relief amounts in both periods. 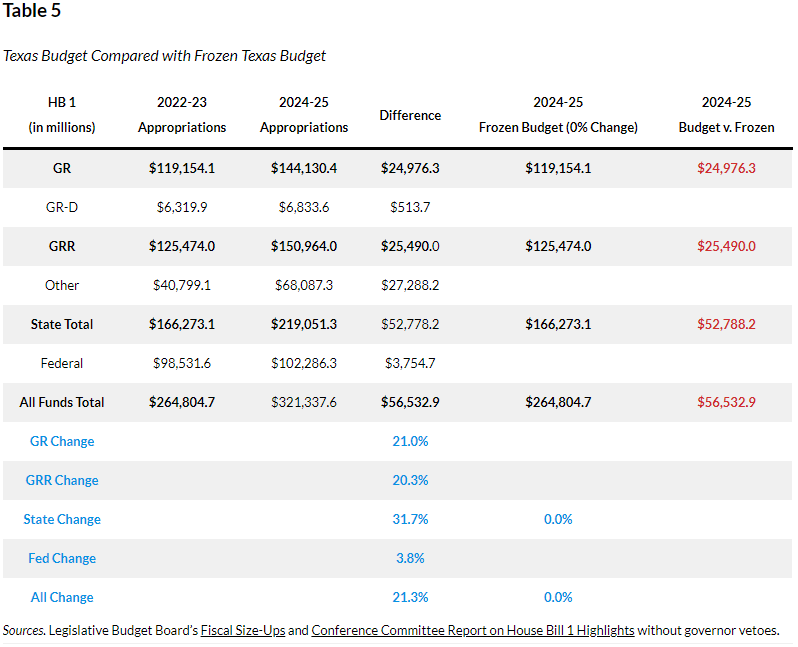 Conclusion
Both approaches show that while the general revenue related (GRR) funds amount is below the rate of population growth and inflation (either plus or times) for the CTB approach, the broader measures of state funds and all funds that better represent the burden of government spending on taxpayers are well above either metric. And when using the frozen Texas budget approach, the only budget amount below either rate of population growth and inflation is federal funds. In other words, the Legislature is using fuzzy math when it comes to the budget and property tax relief. This looks much more like what would be done in California rather than Texas. This is not what Texans want or expect from their elected officials. If this continues, Texas will be California soon. While this is the largest spending increase in Texas history, there was also at least $10 billion in new corporate welfare—the largest in state history. Texas must not sit back on its laurels while ending this populist trend. Texas must do what’s in the best interest for everyone, which is limiting or cutting government spending, taxes, and regulations so there’s more freedom for people to prosper. A better path would have been to spend less and put Texas on a path to eliminate property taxes so Texans can have the right to own their property instead of perpetually renting from the government. By following the Texans for Fiscal Responsibility’s three-step process of passing a frozen state budget, using 90% of surplus dollars to compress school district M&O property tax rates until they are zero, and having local governments eliminate the rest of their property taxes with surplus dollars above a new local spending limit, Texas can eliminate property taxes soon. There’s a chance to do so during a special session during the interim or next session. Originally published with links at Texans for Fiscal Responsibility.  An Overview
The good news is that state officials in Texas have been debating how to provide one of the largest tax cuts in the state’s history and were even talking about eliminating school maintenance and operations (M&O) property taxes. But that good news withered away in the second special session of the 88th Texas Legislature, as the amount looks to be only about $12.7 billion in new relief (an additional $5.3 billion to maintain past relief was passed in HB 1 budget) of the at least $33 billion surplus. And given that the largest property tax cut was $14.2 billion for 2008-09, the state would need to provide $21 billion in new relief this time for it to be the largest tax cut in Texas history, so Texans could have the same purchasing power of relief as they had then. While there has been a lot of debate on how the state should provide property tax relief of school district maintenance and operations (M&O) property taxes, which comprise more than 40% of total property taxes collected by local governments across the state, the best way to provide the most relief to everyone is through compression. This is simply using state dollars—mostly through sales taxes—to buy down school district M&O property tax rates that the state mostly controls with its school finance formulas. Instead, the compromise between the House and Senate, which Governor Abbott looks poised to sign, is a watered-down approach that provides too little in relief—just $12.7 billion in new relief in SB 2 (88(2))—because they chose to spend too much. And there is too little in compression with just $7 billion for 10.7 cents per $100 valuation in reduction for school M&O property taxes. The rest is a combination of raising the homestead exemption for school districts by $60,000 to $100,000, limiting non-homestead appraisal growth to 20% for three years, and requiring three directors on appraisal district boards to be elected with counties that have a population of 75,000 or more. The next part of the package is SB 3 (88(2)), raising the franchise tax exemption for gross revenue to $2.45 million from $1 million. The final piece is HJR 2 (88(2)), which puts this package (except the compression) on the November 7, 2023, ballot for voters to consider approving. While it is good that there is so much going to tax relief, this package will make the tax system more complicated, make it more difficult to eliminate school M&O property taxes, contribute to higher school M&O property tax rates, and shift the burden around as homesteads and small businesses are chosen as the winners while renters and other employers are losers. The government should not be in the business of socially engineering people’s lives through the tax code by picking winners and losers, and this is exactly what this package does. Paths to Eliminating Property Taxes I have long researched and published on eliminating property taxes in Texas. There are different ways to do it, but the one discussed most recently by Texans for Fiscal Responsibility and Governor Abbott was the buy-down of school M&O property taxes until they’re eliminated, something I supported in a paper I co-authored in 2018. The plan has been through multiple iterations. My July 2021 co-authored paper looked at this buy-down approach of using 90% of state surplus dollars above a stricter spending limit of population growth plus inflation to compress school M&O property tax rates until they are zero within about a decade; the other approach explored in this paper was of tax reform that would broaden the sales tax base to eliminate those taxes immediately, without raising the rate, based on a dynamic economic model. Both of these were built on a strong spending limit, given spending is the ultimate burden of government on taxpayers. The latest was a December 2022 co-authored paper where we address the affordability crisis in Texas and how the buy-down plan would help with this while providing more economic growth. I also wrote a 2023 paper updating this based on how quickly this could be done if a frozen budget with zero growth was used to provide more surplus funding to eliminate these property taxes. I also wrote another 2023 paper noting how there is no need to be fearful about a recession or reduced revenue as there would be the need for spending restraint or cuts, plenty of money in the rainy day fund, or excess reserves held by school districts to address any shortfall to maintain the relief and fund public education. Adding to this research were two professors at Rice University who, in 2018, also studied different reforms of the buy-down approach and the sales tax expansion approach to eliminate school M&O property taxes. They found that these approaches would provide substantial benefits to the state in terms of increased economic growth and job creation. After reviewing different options for the buy-down approach, compression is best because everyone benefits, including from the dynamic effects of more growth, more jobs, and lower prices. It’s also the only way that’s being discussed today to get the school M&O property tax rate to 0%. Another approach to provide property tax relief was pushed by the Senate this year and looks to be included in the bill passed in the second special session: raising the homestead exemption from $40,000 to $100,000. But this approach will never eliminate those taxes and will push the burden of funding spending to everyone else, making the system less equitable while quickly evaporating any relief from appraisal growth and making the path to elimination harder because rates will rise from it when school spending increases. Given the different approaches discussed this year by the House and governor and then the Senate and lieutenant governor, I did an analysis of the median valued home in Texas of $350,000 in Austin, Houston, and Dallas. I used the tax rates for each of these locations and had the home increase in value by 10% per year, which is the maximum growth for a homestead under current law. I didn’t change anything else to provide an apples-to-apples comparison of a tax reform in 2023 to estimate what would happen over the next five years given a 1) $60,000 increase in the homestead exemption, 2) SB 1 (88(1)) with $60,000 increase in the homestead exemption and 10-cent compression (similar to tax relief package in second special session), 3) HB 1 (88(1)) with 16.2-cent compression, and 4) what would be largest tax cut in Texas history of $21 billion with a 25-cent compression. I should note that this modeling is just on a homestead, so it doesn’t account for the much more broad-based effects of the compression scenarios. Austin The following three charts are for Austin, including Austin ISD, to see what these four scenarios would look like given the assumptions above in each year. The first chart shows what would happen for total property taxes (i.e. ISD, city, county, and special purpose district property taxes) under these scenarios compared with the total tax paid of $5,945 for a $350,000 home in Austin. The results show that SB 1 and the 25-cent compression are similar; however, both of them would have only one year of lower total property taxes until 2025, when the amount paid would exceed that of 2023. The second chart shows similar results as SB 1 and the 25-cent compression have the greatest effects on the 2023 ISD M&O property taxes of $3,089. However, HB1 also provides relief until 2028, when the amount paid would exceed that of 2023. But, more importantly, given these are only homesteads and don’t account for families who pay rent or own a business, the third chart’s example shows that HB 1 with 16.2-cent compression and the 25-cent compression cut the tax rate the most over time, as this compression in just 2024 continues to buy down the rate as values increase by 10%. 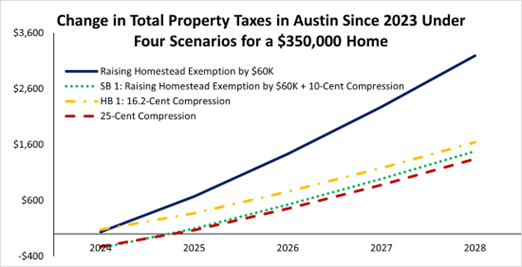 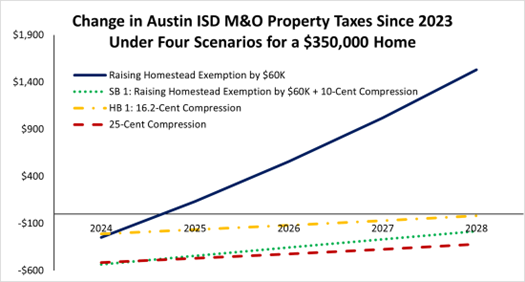 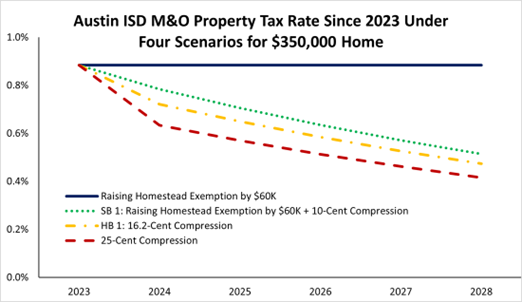 Houston The following charts are for Houston, with similar results for each of the scenarios. 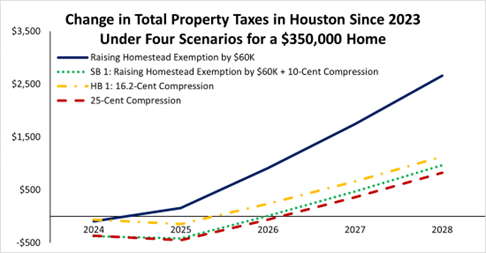 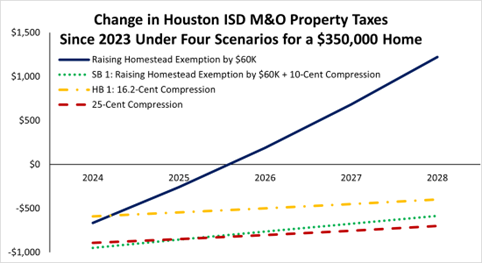 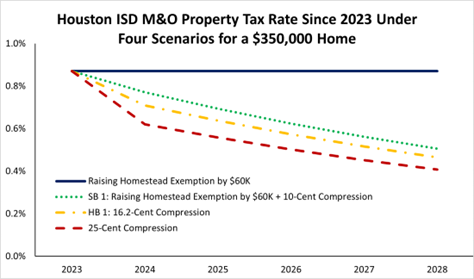 Dallas The following charts are for Dallas, with similar results. 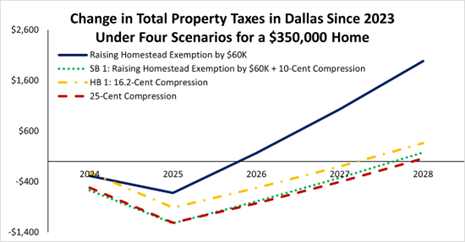 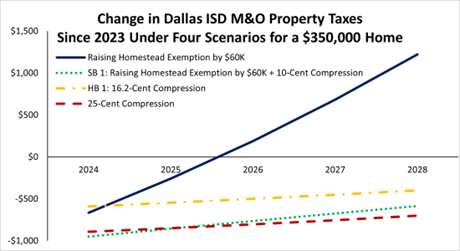 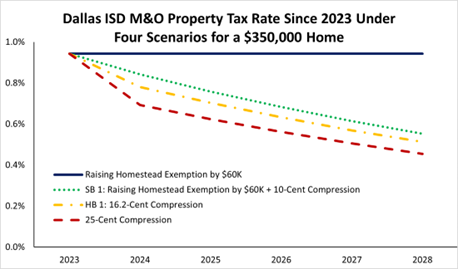 In my conversations with CBS News Texas, ABC 13 Houston, and The Texan, I recently explained how compression is the gold standard to eliminate school M&O property taxes. I also recently wrote[VG1] how the Texas Legislature had the largest spending increase in Texas history this session, thereby not providing enough in property tax relief. I argued that Governor Abbott should veto the budget or at least $8 billion of budget items and use it for compression so that Texans get record relief. But that did not happen. It should be noted that compression will help renters. The Texas comptroller’s report (see Table 33 below) finds that 26% of school property taxes is passed along to renters. Businesses submit 52% of those taxes, but people pay for them through higher prices, lower wages, fewer jobs, and higher rent. Simple supply and demand shows that the property taxes would rotate the private market supply of housing leftward, thereby raising rents and lowering the quantity supplied compared with the free market. In other words, the market does set the rents, but that market is distorted by property taxes, so removing those school taxes would help push down rents through competition. When the landlord has a vacancy and is paying lower property taxes, then she will lower the rent given lower cost to attract tenants. It may not happen overnight, but it will as that’s how competition works, and those businesses that don’t will be forced out of the market through losses. This wouldn’t just be a shift in supply of housing that would reduce rents; that would happen some when this tax is cut and certainly when it’s eventually eliminated, but that’s not the only way. 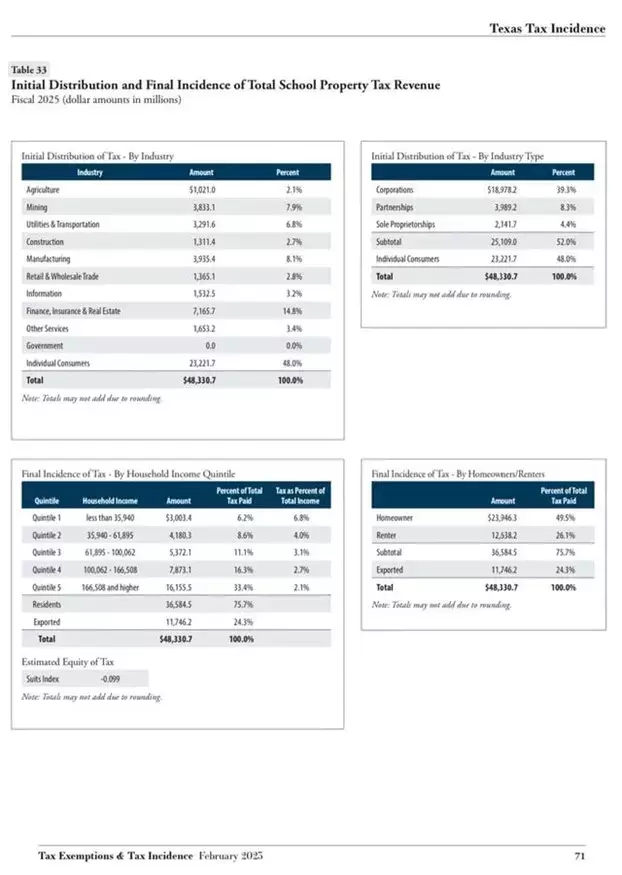 The following chart shows that there’s movement down the demand curve as the supply curve corrects to the private supply curve (S1) rather than the distorted supply curve (S2) with the ad-valorem property tax, which will lower prices and increase the quantity supplied. This is through competition that will happen as consumers will have more negotiating power and landlords will want to rent out every unit but won’t if they don’t lower their rents, as their competition will because their costs have been reduced. 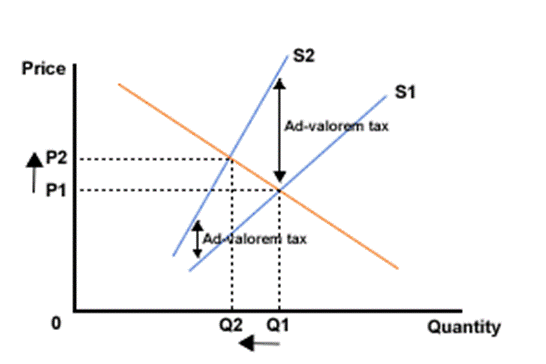 From the fact that property taxes are going down, there’s a reduction in cost by the landlords, so they have the ability to get more renters at a lower rent. As renters know, if property taxes don’t go down, they will go to another location—hence more consumer power. The consumer has much power in every market if they choose to wield it, especially when government gets out of the way. Again, it wouldn’t change rents overnight, as many are in leases, but it would over time. One of the issues contributing to the affordability crisis in Texas, especially for lower-income folks, is skyrocketing property taxes. Any relief would be most appreciated by 100% of property holders through compression. Lowering school M&O property tax rates through compression is the best path for everyone to benefit from lower taxes, more economic growth, and tax rates that would go to zero. Many groups shown in the page below have already stated their support for the buy-down plan, which was supported by the governor; the House passed much of it, though that was mostly thrown out in the final package. And they needed to add HB 16 (88(2)) by State Rep. Briscoe Cain, which would put in statute the buy-down plan to zero, along with his HB 17, which would impose spending limits on local governments. 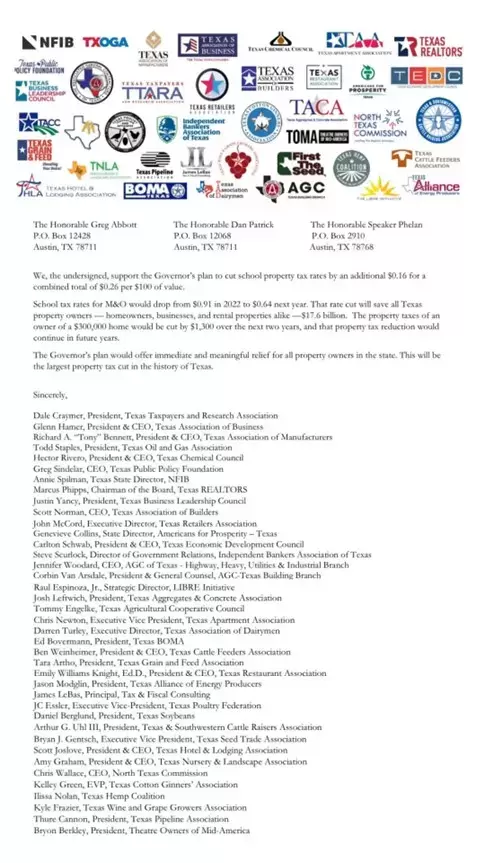 Conclusion
At the end of the day, I’m glad Texans are talking about property tax relief. Other states have been cutting taxes, so Texas can’t sit back and be competitive with other states without spending less and cutting taxes, as corporate welfare makes the problems worse. The Legislature unfortunately passed a revamp of the expired Chapter 313 in HB 5 during the regular session. This new version, called Chapter 403, provides property tax abatements issued by school districts to mostly big businesses. Fortunately, when school district M&O property taxes are eliminated, this corporate welfare will be eliminated, too. There are so many reasons to eliminate property taxes. Texas will be an economic juggernaut! And what’s maybe the most important is that Texans will have more of their right to own property preserved instead of renting from the government forever with this immoral wealth tax known as property taxes. Raising the homestead exemption might be a part of the final deal, but we should remember that it picks winners and losers, is not sound tax policy, and has been tried three times (1997, 2015, and 2021) without substantial reductions in those taxes paid. I’m okay with broadening the sales tax base and eliminating school M&O property taxes immediately and using surplus dollars above a stricter spending limit to buy down sales taxes over time. This would also broaden the sales tax base for local governments, which should use those funds to buy down their own property taxes and limit their spending with a restrictive limit like the state’s based on population growth and inflation to use surplus dollars to buy down the rest until they are zero. But there isn’t the political will yet to take this approach, so the best way right now is the buy-down path for school property taxes by the state and local government buying down their own could happen over the next decade for the eventual elimination of all property taxes in Texas. The way to do this is by sufficiently reining in government spending, which the Legislature did not do this session—thereby wasting an unprecedented opportunity to do something big. Eliminate school property taxes first, then find a way to eliminate the rest. My preference is to limit all local government spending to the state’s spending limit based on population growth and inflation, and use 90% of their surpluses to buy down their own property taxes until they are zero. This is a path to giving Texans their God-given right to own property. Get tax relief done for Texans! Stop renting, start owning! Originally published by Texans for Fiscal Responsibility. Research: The Inflation Reduction Act's Costly New Tax Credits for Electric Vehicle Batteries4/10/2023  Executive Summary The U.S. Congress passed and President Biden signed into law the so-called “Inflation Reduction Act” (IRA) in August 2022. The IRA includes many provisions which are now estimated to cost $1.2 trillion over a decade per Goldman Sachs’ more recent analysis compared with the Congressional Budget Office’s (CBO) initial estimate of $391 billion. Part of this substantially higher estimated cost is because of the new cost estimates for tax credits for electric vehicle (EV) battery cells and modules manufactured in the U.S. Instead of the initially estimated cost of $30.6 billion by the CBO, new estimates based on more precise projections and growth in the EV market indicate that this could be as high as $196.5 billion (540% higher than initially estimated) per the Mercatus Center and Goldman Sachs. This higher estimate appears more accurate than the original CBO estimate given the large increase in the EV market and the expanding use of these tax credits. Given that the cost of these subsidies passed by Congress and communicated to the public appears to be substantially undervalued, the CBO and other nonpartisan agencies and committees responsible for providing Congress with accurate revenue estimates and sound economic analysis should reexamine their calculations. Originally published at Americans for Tax Reform. |
Vance Ginn, Ph.D.
|

 RSS Feed
Proudly powered by Weebly