|
Join me for this episode as I discuss the COVID lockdowns in Australia, the fight for liberation, and Topher Field's incarceration. Don't miss this inspiring conversation on human rights and the power of resilience. 💪
Like, subscribe, and share the Let People Prosper Show, and visit vanceginn.substack.com and vanceginn.com for more insightful content.
0 Comments
Today, I'm joined on episode 68 of the "Let People Prosper" show by Dr. Carlos Carvalho who is a Professor in Statistics at the University of Texas-Austin and Director of the Salem Center.
Please like this video, subscribe to the channel, share it on social media, and provide a rating and review. Also, subscribe and see show notes for this episode on Substack (www.vanceginn.substack.com) and visit my website for economic insights (www.vanceginn.com). We discuss: 1) Economic lessons that Dr. Carvalho learned living in Brazil during the 80s while the nation suffered from hyperinflation and how it relates to current overspending by Congress in the U.S. (see more on this in my episode with Dr. John Cochrane); 2) The importance of federalism and letting markets work; and 3) How the pandemic was mishandled and the importance of understanding tradeoffs. Today, I'm honored to be joined by Dr. Jay Bhattacharya, Professor of Health Policy at Stanford University and a research associate at the National Bureau of Economics Research. We discuss: 1) How the U.S. policy response to the COVID-19 pandemic harmed the poor, working class, and children and the subsequent side effects those groups continue to grapple with (see his Twitter thread here for more details); 2) Why shutting down the economy and enforcing social distancing is not effective from a health and medicine perspective and a better alternative; and 3) Why Dr. Bhattacharya fears the U.S. would have the same response in the event of another pandemic and his suggestions for how to handle one. Dr. Bhattacharya’s bio:
Key Point: Americans are suffering under big-government policies as average weekly earnings adjusted for inflation are down for 21 straight months. It's time for pro-growth policies to unleash economic potential to let people prosper. 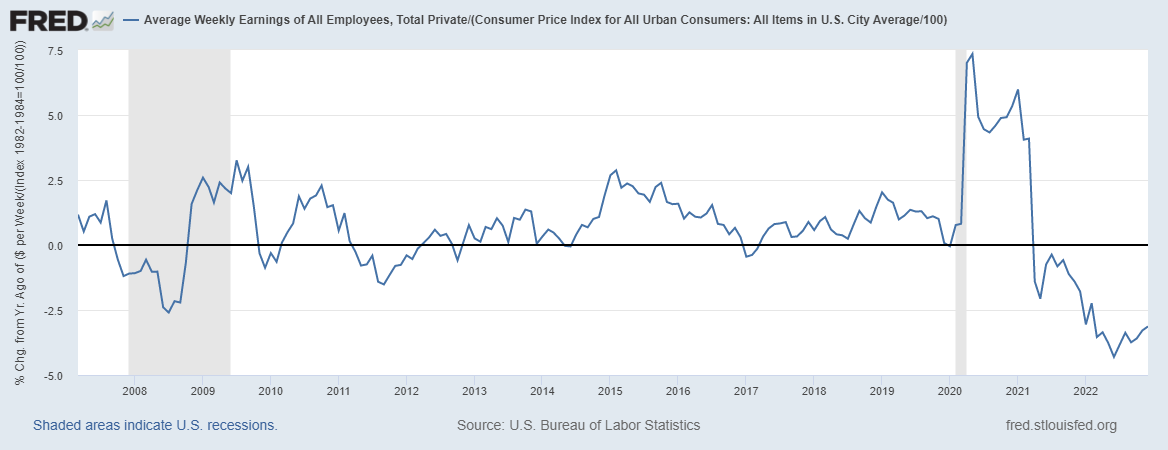 Overview: The irresponsible “shutdown recession” and subsequent government failures have led to a longer, deeper recession with high inflation that are having persistent consequences for many Americans’ livelihoods. This includes excessive federal spending redistributing scarce private sector resources with deficit spending of more than $7 trillion since January 2020 to reach the new high of $31.4 trillion in national debt—about $95,000 owed per American or $250,000 owed per taxpayer. This new debt has hit its limit and needs to be addressed with spending restraint as the Federal Reserve monetized most of the new debt, leading to a 40-year-high inflation rates. The failed policies of the Biden administration, Congress, and the Fed must be replaced with a liberty-preserving, free-market, pro-growth approach by the new majority by House Republicans so there are more opportunities to let people prosper. 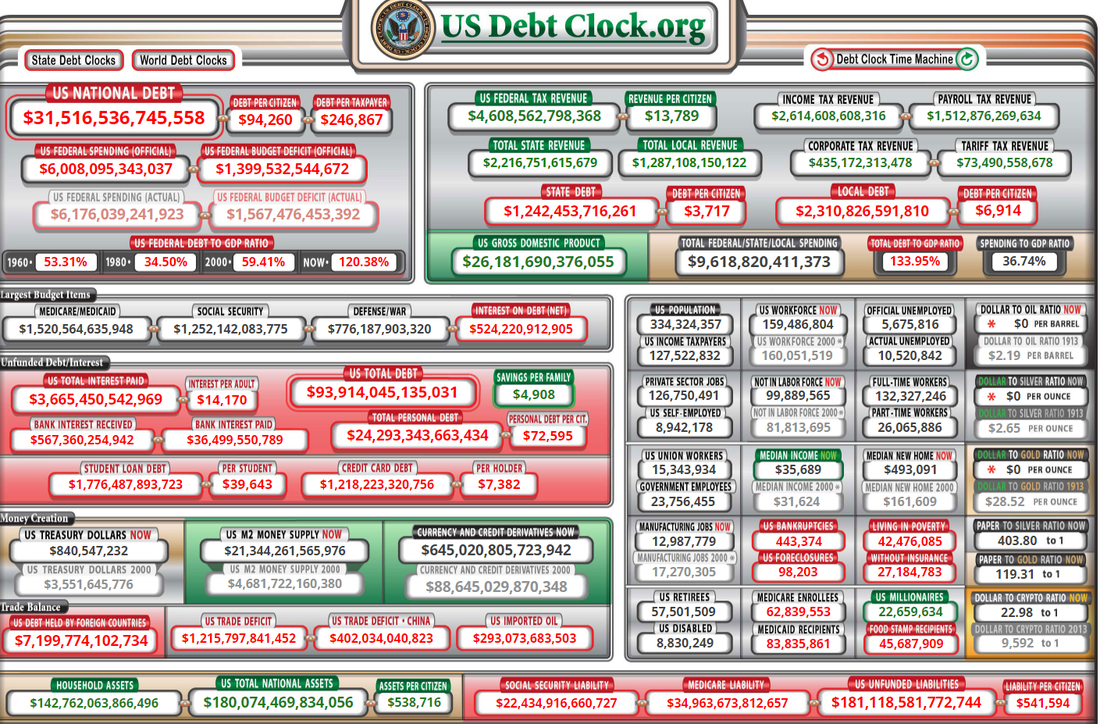 Labor Market: The U.S. Bureau of Labor Statistics recently released the U.S. jobs report for December 2022. The BLS’s establishment report shows there were 223,000 net nonfarm jobs added last month, with 220,000 added in the private sector. Interestingly, while there have appeared to be a relatively robust number of jobs created, a recent report by the Philadelphia Fed find that if you add up the jobs added in states in Q2:2022 there were just 10,500 net new jobs rather than more than 1 million initially estimated. This further indicates that the recession started in (likely) March 2022 (more on this below). That expected revision to the establishment report supports the weak data in the BLS’s household survey, which employment increased by 717,000 jobs last month but had declined in four of the last nine months for a total increase of 916,000 jobs since March 2022. This number of net jobs added since then is much lower than the report 2.9 million payroll jobs in the establishment. The official U3 unemployment rate declined slightly to 3.5%, but challenges remain, including: 3.1% decline in average weekly earnings (inflation-adjusted) over the last year, 0.4-percentage point lower prime-age (25–54 years old) employment-population ratio than in February 2020, 0.6-percentage point below prime-age labor force participation rate, and 1.0-percentage-point lower total labor-force participation rate with millions of people out of the labor force. 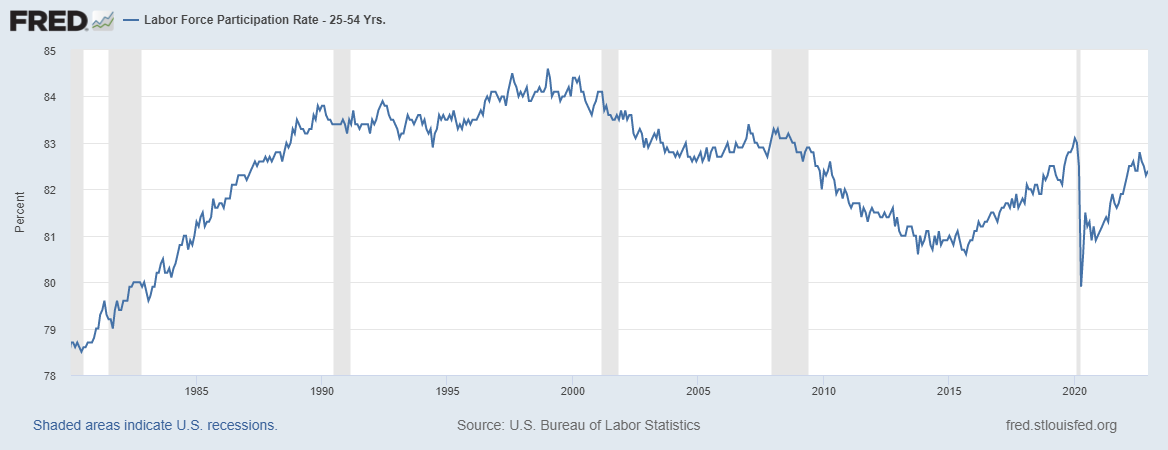 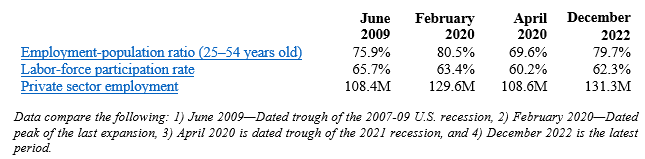 These data support my warnings for months of stagflation, recession, and a “zombie economy.” This includes “zombie labor” as many workers are sitting on the sidelines and others are “quiet quitting” while there’s a declining number of unfilled jobs than unemployed people to 4.5 million And that demand for labor is likely inflated from many “zombie firms,” which run on debt and could make up at least 20% of the stock market and will likely lay off workers with rising debt costs. Economic Growth: The U.S. Bureau of Economic Analysis’ released economic output data for Q4:2022. The following provides data for real total gross domestic product (GDP), measured in chained 2012 dollars, and real private GDP, which excludes government consumption expenditures and gross investment. 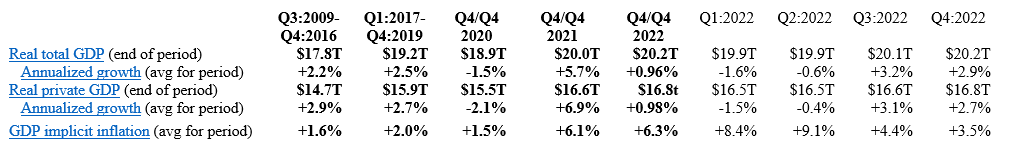 The shutdown recession in 2020 had GDP contract at historic annualized rates because of individual responses and government-imposed shutdowns related to the COVID-19 pandemic. Economic activity has had booms and busts thereafter because of inappropriately imposed government COVID-related restrictions in response to the pandemic and poor fiscal policies that severely hurt people’s ability to exchange and work. Since 2021, the growth in nominal total GDP, measured in current dollars, was dominated by inflation, which distorts economic activity. The GDP implicit price deflator was +6.1% for Q4-over-Q4 2021, representing half of the +12.2% increase in nominal total GDP. This inflation measure was +9.1% in Q2:2022—the highest since Q1:1981—for a +8.5% increase in nominal total GDP that quarter. This made two consecutive declines in real total (and private) GDP, providing a criterion to date recessions every time since at least 1950. In Q3:2022, nominal total GDP was +7.6% and GDP inflation was +4.4% for the +3.2% increase in real total GDP. But if inflation had been as high as it was in the prior two quarters or had the contribution of net exports of goods and services (driven by natural gas exports to Europe) not been 2.9%, real total GDP would have either declined or been essentially flat for a third straight quarter. In Q4:2022, there was a similar story of weaknesses as nominal total GDP was +6.4% and GDP inflation was +3.5% for the +2.9% increase in real total GDP. But if you consider the +2.9% real total GDP growth was driven by contributions of volatile inventories (+1.5pp), government spending (+0.6pp), and next exports (+0.6pp) which total +2.7pp, the actual growth is quite tepid. For all of 2022, real total GDP growth is reported +2.1% year-over-year but measured by Q4-over-Q4 the growth rate was only +0.96%, which was the slowest Q4-over-Q4 growth for a year since 2009 (last part of Great Recession). 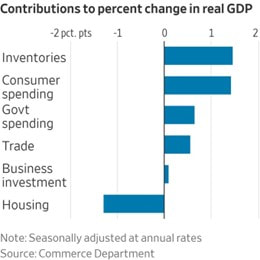 The Atlanta Fed’s early GDPNow projection on January 27, 2023 for real total GDP growth in Q1:2023 was +0.7% based on the latest data available. The table above also shows the last expansion from June 2009 to February 2020. The earlier part of the expansion had slower real total GDP growth but had faster real private GDP growth. A reason for this difference is higher deficit-spending in the latter period, contributing to crowding-out of the productive private sector. Congress’ excessive spending thereafter led to a massive increase in the national debt that would have led to higher market interest rates. This is yet another example of how there is always an excessive government spending problem as noted in the following figure with federal spending and tax receipts as a share of GDP. 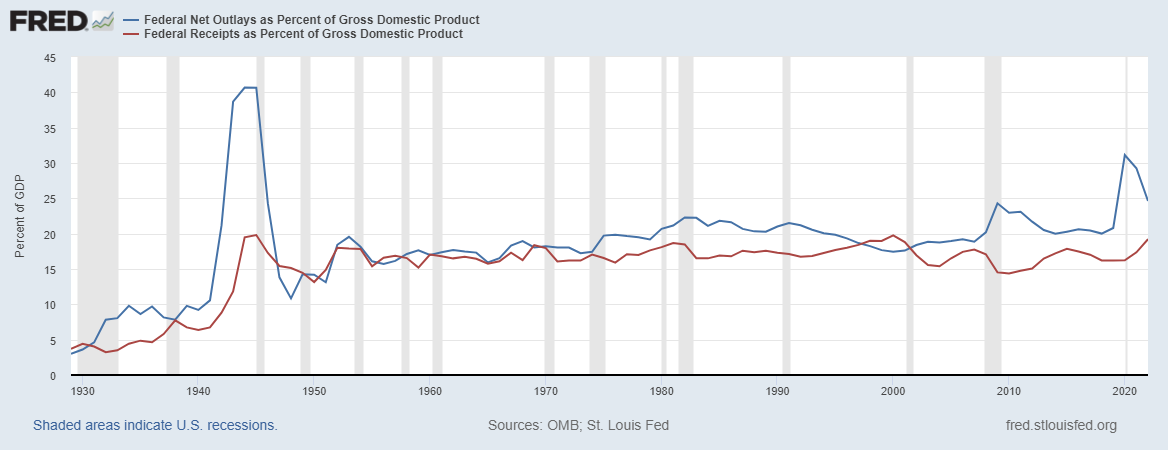 But the Fed monetized much of it to keep rates artificially lower thereby creating higher inflation as there has been too much money chasing too few goods and services as production has been overregulated and overtaxed and workers have been given too many handouts. The Fed’s balance sheet exploded from about $4 trillion, when it was already bloated after the Great Recession, to nearly $9 trillion and is down only about 6% since the record high in April 2022. The Fed will need to cut its balance sheet (see first figure below with total assets over time) more aggressively if it is to stop manipulating so many markets (see second figure with types of assets on its balance sheet) and persistently tame inflation. 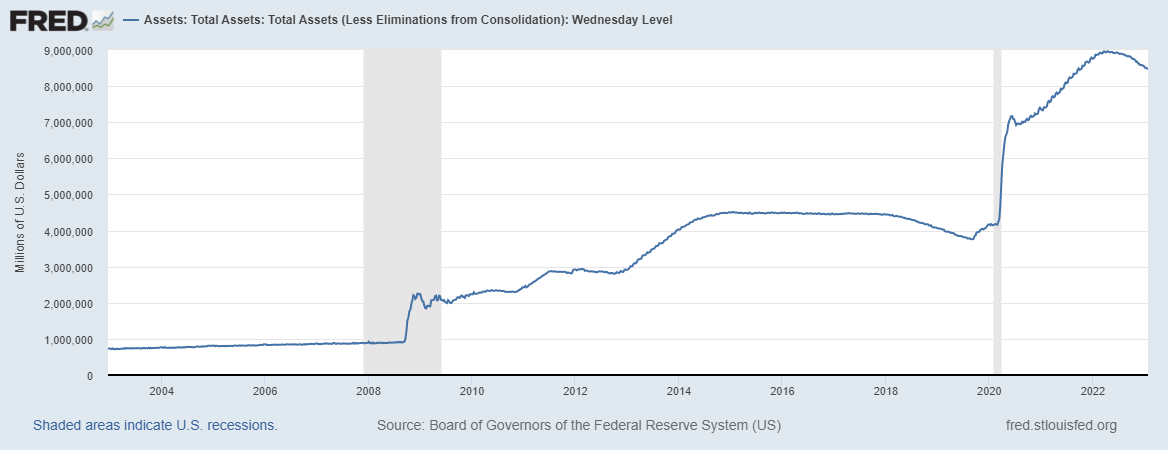 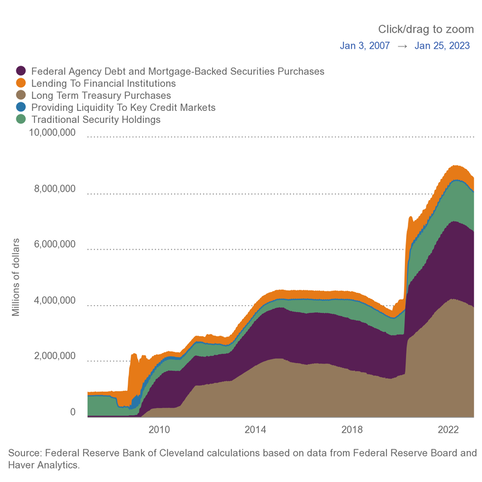 The resulting inflation measured by the consumer price index (CPI) has cooled some from the peak of 9.1% in June 2022 but remains hot at 6.5% in December 2022 over the last year, which remains at a 40-year high (highest since June 1982) along with other key measures of inflation (see figure below). After adjusting total earnings in the private sector for CPI inflation, real total earnings are up by only 1.1% since February 2020 as the shutdown recession took a huge hit on total earnings and then higher inflation hindered increased purchasing power. 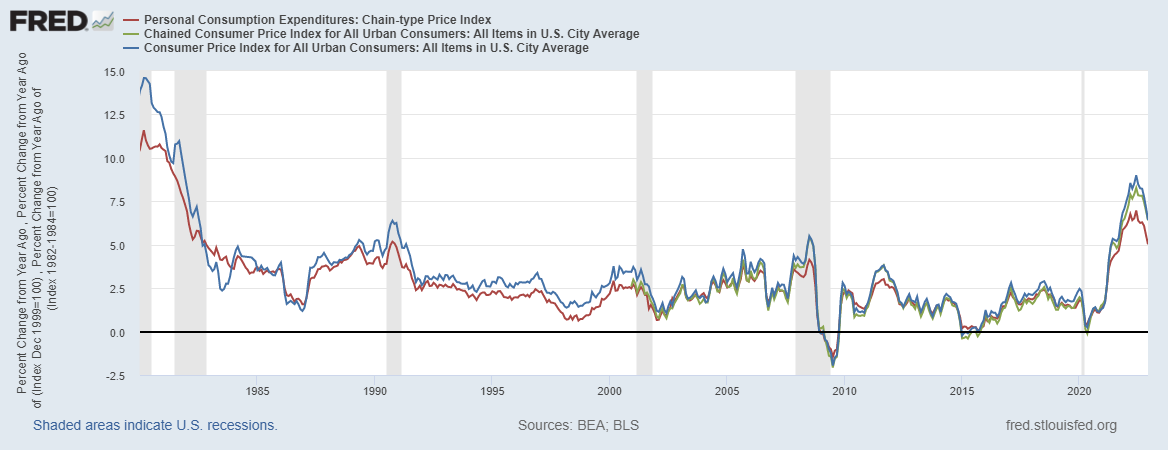 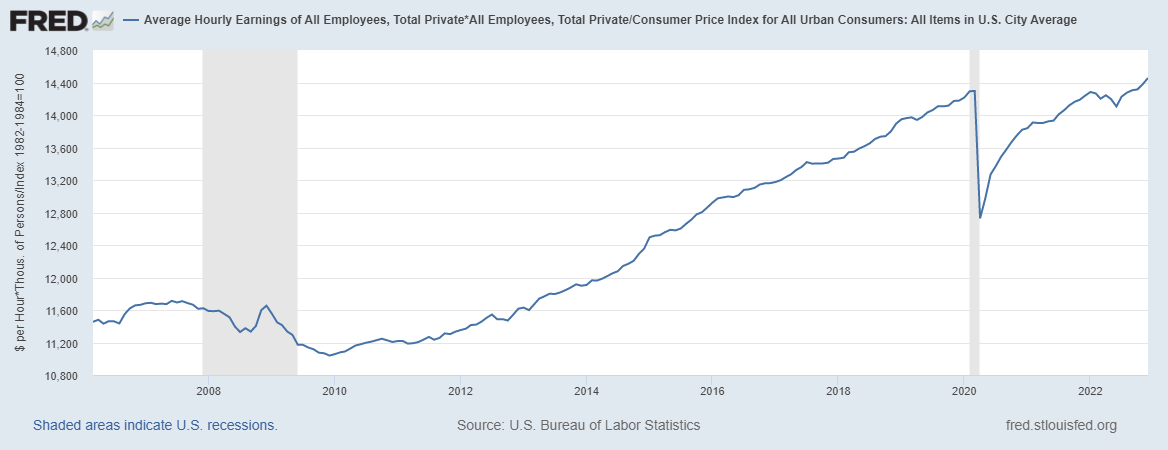 Just as inflation is always and everywhere a monetary phenomenon, high deficits and taxes are always and everywhere a spending problem. The figure below (h/t David Boaz at Cato Institute) shows how this problem is from both Republicans and Democrats. 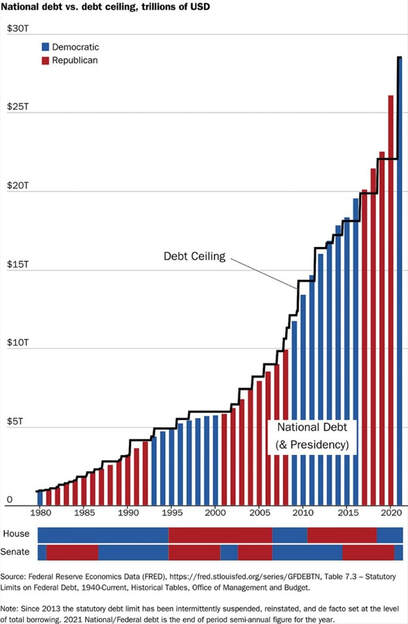 As the federal debt far exceeds U.S. GDP, and President Biden proposed an irresponsible FY23 budget and Congress never passed one until the ridiculous $1.7 trillion omnibus in December, America needs a fiscal rule like the Responsible American Budget (RAB) with a maximum spending limit based on population growth plus inflation. If Congress had followed this approach from 2002 to 2021, the (updated) $17.7 trillion national debt increase would instead have been a $1.1 trillion decrease (i.e., surplus) for a $18.8 trillion swing to the positive that would have reduced the cost to Americans. The Republican Study Committee recently noted the strength of this type of fiscal rule in its FY 2023 “Blueprint to Save America.” And the Federal Reserve should follow a monetary rule.
Bottom Line: Americans are struggling from bad policies out of D.C., which have resulted in a recession with high inflation. Instead of passing massive spending bills, like passage of the “Inflation Reduction Act” that will result in higher taxes, more inflation, and deeper recession, the path forward should include pro-growth policies. These policies ought to be similar to those that supported historic prosperity from 2017 to 2019 that get government out of the way rather than the progressive policies of more spending, regulating, and taxing. The time is now for limited government with sound fiscal and monetary policy that provides more opportunities for people to work and have more paths out of poverty. Recommendations:
 The fact that our nation’s unemployment rate is approaching the low rate of 3.5% that was reached just prior to the pandemic should be a cause for celebration. But for a variety of reasons, the official unemployment number is misleading.
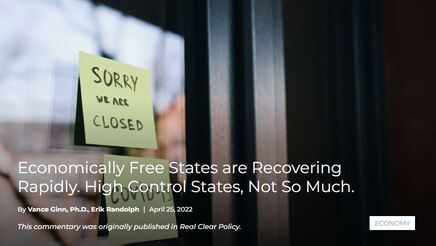
The employment situation is not as rosy as it may seem. There is a wide disparity among the states that can be explained by how much economic freedom they allow, including how severely each state shut down its economy due to the COVID-19 pandemic. Consider that the U.S. remains 1.6 million jobs short of our February 2020 high, just before the pandemic came to our shores. Since then, our population has grown by 3.8 million people but the labor force shrank by 174,000 workers. The picture diverges for states. As demonstrated in our 2021 study, the states with the worst job recovery also imposed the harshest COVID-19 measures. For example, two states with the severest lockdowns — California and New York — are also experiencing two of the worst job recoveries, with unemployment rates at least a full percentage point above the national average of 3.6% based on the newly released March 2022 data. Conversely, Utah and Nebraska, who are among the states with the least severe lockdown policies, are tied with the lowest unemployment rate of 2.0%, well below the national average. In measuring how states have rebounded, a better metric than the unemployment rate is the recovery in private employment. Only 16 states have recovered all the private jobs lost due to the shutdowns compared to February 2020. But if we account for each state’s pre-pandemic job growth trajectory, our analysis shows that Montana and Utah stand above the rest for exceeding our forecast of their private employment. Idaho follows closely behind Montana and Utah, and then Wyoming, North Carolina, Mississippi, South Dakota, Arkansas, Maine, and Georgia to round out the top 10 performing states. Except for Maine and North Carolina, each one has a Republican trifecta (GOP controls both chambers of the legislature and the governor’s office). North Carolina leans Republican, and Maine is the anomaly having a Democrat trifecta. What about the bottom 10 states in private-sector jobs recovery? They are Hawaii, New York, North Dakota, California, Maryland, Vermont, Minnesota, Oregon, Massachusetts, and Louisiana. Four of those have Democrat trifectas and four lean Democrat. Louisiana, the last state to make the bottom 10, leans Republican. North Dakota — a Republican trifecta that had one of the least restrictive COVID policies — is a special case due to an unusual economic situation. Its pre-pandemic job growth numbers differed from all other states, and it also relies more heavily on mining and petroleum than any other state. Its petroleum industry went bust in 2014, causing private employment to peak in December 2014 that finally bottomed out in January 2017. Since then, its private job growth has been slow, less than 1% per year. President Biden’s anti-fossil fuels executive orders, including the cancellation of the Keystone XL Pipeline, have only made matters worse for North Dakota. Putting this outlier aside, what accounts for this dramatic difference in recoveries between red and blue states? As already indicated, Republican governors were less severe with their lockdown policies. For another, all Republican governors (with the exception of Louisiana) ended supplemental unemployment payments before they were set to expire last September. These payments contributed to some people receiving more than they would have had they been working. In fact, one study finds that those states that didn’t end these payments early contributed to 3 million fewer people in the labor force. Underlying the difference is likely the extent of economic freedom in each state. Using the Economic Freedom of North America 2021 report published by the Fraser Institute, which is based on 2019 data, the top 17 states allowing for the most economic freedom either lean Republican or have Republican trifectas. In fact, 14 of them are the trifectas. Eight of the bottom 10 have Democrat trifectas, with New York leading the pack, followed by California. The other two in the bottom 10 include Vermont that leans Democrat and West Virginia with a Republican trifecta. The best path to prosperity is a job. Work brings dignity, hope, and purpose to people by allowing them to earn a living, gain skills, and build social capital that endures. Advancing policies that connect people with work, along with reducing barriers for new jobs and opportunities, should be our goal, rather than making a government the first resort for help that disconnects people from what work brings. The red states are showing the way to achieve this sound policy. Other states should follow while things at the federal level look bleak. But as our founders desired, the system of federalism that breeds a laboratory of competition helps shed light on what works best to let people prosper. https://www.texaspolicy.com/economically-free-states-are-recovering-rapidly-high-control-states-not-so-much/ 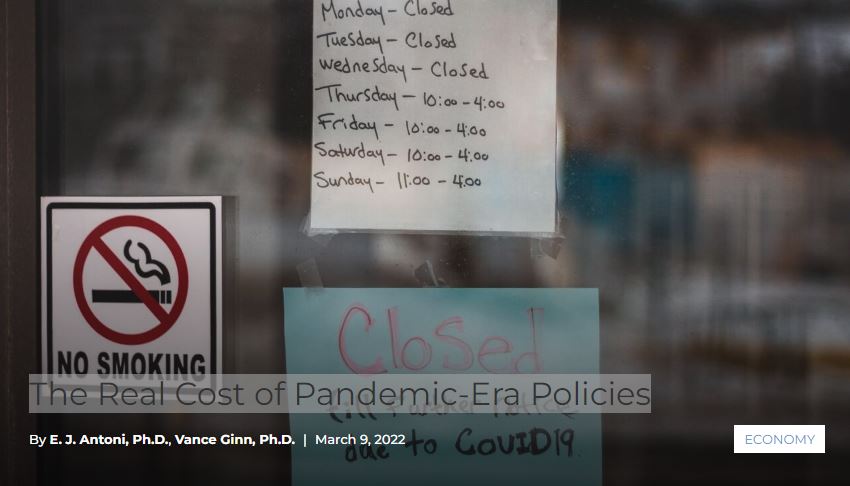 It’s bad enough when politicians enact witless economic policies with huge price tags, but it’s even worse when those policies destroy American lives and livelihoods. New research shows that this will be the pandemic-era legacy of the politicians that forcibly closed businesses, made people stay home, then incentivized millions of out-of-work Americans to give up the opportunity to get their lives back on track.
It’s now clear that half the states kept destructive policies in place even after their devastating effects were known. What should have been a temporary bridge to keep people afloat while America tackled COVID-19 became a nightmare of dependence and depression. In March of 2020, the federal government began paying weekly “bonuses” known as supplemental insurance to people on unemployment. That meant many people received more money from unemployment insurance than they did while working. It was even expanded to include those who hadn’t paid into the program. By the fall, the country began emerging from the pandemic, vaccines became available, and business started to open again and look for workers. The speed of American resilience was something to behold. But the government refused to make the transition with the rest of the country and kept paying people to stay home. Eliminating people’s jobs and paying them to be unemployed was robbing millions of Americans of the dignity that comes with finding purpose and achieving self-sufficiency. It destroyed lives, driving dependency on government, contributing to drug and alcohol addiction, and exacerbating isolation and depression. These effects of the program were blatantly obvious through the spring of 2021 but that didn’t stop the Biden Administration and Congress from extending the benefits through September. By the summer of 2021, the nation had nearly 11 million unfilled jobs, a spike from just under 7.2 million at the beginning of the year. That’s why 26 states decided to terminate the unemployment bonuses early instead of letting them expire in September 2021. At the time, some in the media portrayed the move as cruel, ripping critical funds away from those struggling during the pandemic. But new research from the Texas Public Policy Foundation shows that the states that ended the benefits early had superior job growth, ending the soul-crushing dependency inflicted upon millions by the misguided policy. By the end of 2021, only Texas and three other states that ended the bonuses early had regained all the jobs that they lost during the pandemic. In the states that continued paying the unemployment bonuses through September 2021, job growth was anemic. Roughly 3 million more people stayed on unemployment in states that maintained the increase in benefits versus the states that ended the program early. The states that continued this policy deserve particular scorn for going down this fatuous path because they should have known better. The unemployment bonuses were first implemented in 2020 during the depths of the government-imposed restrictions and the disastrous results were known a year later. Yet they pushed forward full throttle irrespective of the harm it was causing to millions of Americans. There were better solutions. Early in the pandemic when much wasn’t known, Congress could have eliminated federal payroll taxes. Instead of creating a new disincentive to work, policymakers could have removed an existing disincentive and let workers keep more of what they earned. A July 2020 study found that eliminating payroll taxes would have added 2.7 million jobs in six months. Later, after we learned more about the pandemic and the costs of shutdowns, the Biden administration should have focused on ending state government-imposed shutdowns. These shutdowns were a failure that did little to nothing to mitigate the pandemic’s effects yet contributed to massive business closures and job losses, along with a host of other problems that will be long-lasting.. The experiment with unemployment “bonuses” should be closed and never opened again. It unnecessarily prolonged the economic devastation brought on the country by the pandemic and slowed the path to recovery for millions of Americans. Job creation proved to be the fastest road to provide help and hope. https://www.texaspolicy.com/the-real-cost-of-pandemic-era-policies/ 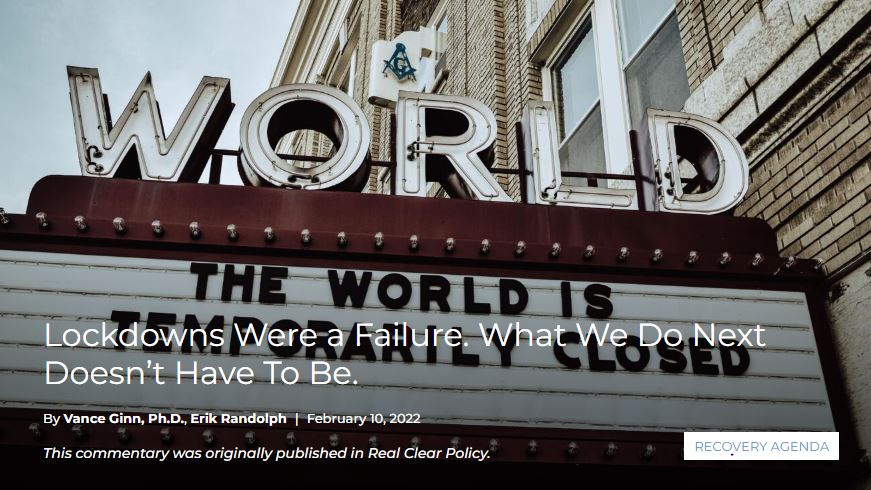 There’s new evidence government-imposed shutdowns prompted by the COVID-19 pandemic have done more harm than good. Instead, a better choice is keeping the economy open so people stay connected to work and targeting resources to vulnerable populations.
A new meta-analysis from Johns Hopkins University underscores this finding, revealing that lockdowns in America and Europe during the first pandemic wave in spring 2020 only reduced the death rate by 0.2% on average. Researchers concluded that lockdowns “have had little to no public health effects” while imposing “enormous economic and social costs” and should be “rejected as a pandemic policy instrument.” While businesses were shuttered, people were forced to stay home, and schools remained closed, the unintended social and economic consequences were clear: Rising unemployment, learning loss among students, spiking rates of domestic violence, and a pandemic-level rise in drug abuse and overdoses. All of that social and economic devastation yielded a minimal impact on health-related suffering due to COVID-19. The new research from Johns Hopkins mirrors our own findings in a recent nationwide study, which found that overreaction by states to waves of the pandemic did substantial damage without much benefit in reducing the effects of the pandemic. The research shows a statistical correlation between how severe state governmental actions were in shutting down their economies and negative impacts on employment more than a year after the pandemic began in America. This was the case even after controlling for a state’s dependence on tourism or agriculture, population density, and the prevalence of COVID-19 infections and hospitalizations. Our research found no correlations between the severity of shutdowns imposed by state governments and the rate of reported COVID-19 hospitalizations or deaths. States like Hawaii, New York, California, and New Mexico that imposed harsher economic restrictions generally have greater job losses even today than those states that were less harsh, such as South Dakota, Iowa, Nebraska, Missouri, and Utah. For example, New York was 10.2% below its trajectory in October 2021 while Nebraska was just 2.4% below. The bottom line is that while policymakers were likely working in good faith to do their best in a challenging situation, it’s crucial we learn from these past mistakes so that we don’t repeat them. And make no mistake about it—those mistakes have driven untold amounts of human suffering during the past two years. The worst part is that the government-imposed shutdowns created even more barriers for people who were already struggling. Every American was impacted, of course. These interventions created challenges and burdens for the middle and upper classes, but for our poorest communities they were outright damaging. Protecting the rights and opportunities of workers to earn a living is obvious. Equally important are the psychological benefits that come with the dignity of work. And there are socio-economic benefits from work that positively impact everyone, such as building social capital and gaining skills, which are especially important for those in marginalized communities who were most impacted by the shutdowns. As the states look for a long-term strategy to deal with the pandemic, it is paramount that they consider the empirical evidence and not impose burdensome restrictions—such as business closures, stay-at-home orders, school closures, gathering restrictions, and capacity limits—on economic activity that have proven to do more harm than good. Instead, the policies need to be crafted more carefully to expand opportunities for the poor and preserve jobs in an open economy in which entrepreneurs can solve problems while taking measures when necessary to protect vulnerable populations. These are the policies that should have been done all along to avoid the severity of the shutdown recession and the effects on lives and livelihoods thereafter. Let’s not make another mistake when so many are already suffering. https://www.texaspolicy.com/lockdowns-were-a-failure-what-we-do-next-doesnt-have-to-be/ Fear and uncertainty over the pandemic are rising again as the first U.S. case of the Omicron variant of COVID-19 was found in a patient in California and has been spreading across the nation. But let’s not panic and jump to solutions. While this could contribute to the second consecutive winter wave, our new research shows why state governments shouldn’t overreact. Instead, we must steer clear of the devastation caused by mistaken shutdowns over the last two years.
Recently, Federal Reserve Chairman Jerome Powell told a U.S. Senate committee that this new variant poses “downside risks” to our country’s economic recovery and inflation headed into 2022. But if recent history is a guide, the economic consequences of Omicron—or future variants—would be mostly from bad policies out of Washington and state capitols. Congress is already running up massive deficits with excessive spending and misguided policies. The Fed has monetized much of that debt issuance, creating too much money that’s chasing too few goods, hence the highest inflation in 39 years. That inflation rate is challenging for the middle class, but it’s devastating to the impoverished who struggle to afford spiking prices of groceries, gasoline, and more. But what’s too often missed is the effect that states had on making what could have been a slowdown or minor recession in response to the pandemic into a severe downturn. Our new research, commissioned by the Georgia Center for Opportunity, finds that the overreaction by states to previous waves did substantial damage without much benefit in reducing the effects of the coronavirus. The research shows a statistical correlation between how severe state governmental actions were in shutting down their economies and negative impacts on employment more than a year after the pandemic began in America. This was the case even after controlling for a state’s dependence on tourism or agriculture, population density, and the prevalence of COVID-19 infections and hospitalizations. Our research found no correlations between the severity of shutdowns imposed by state governments and the rate of reported COVID-19 hospitalizations or deaths. What we do know is that nationally, there are 3.3 million fewer people employed in the private sector since February 2020, a month before the shutdowns in most states. But the job loss is not spread evenly across the country. Our study did not settle for simply comparing the job loss as measured from February 2020, the month before the pandemic hit. Instead, we ran more than 200 ARIMA model forecasts to capture pre-pandemic trajectories in an effort not to skew the results. Not all states had upward trajectories, and job growth rates varied from −0.8% to 2.9% for the 12 months prior to the pandemic. States like Hawaii, New York, California, and New Mexico that imposed harsher economic restrictions generally have greater job losses even today than those states that were less harsh, such as South Dakota, Iowa, Nebraska, Missouri, and Utah. For example, New York was 10.2% below its trajectory in October 2021 while Nebraska was just 2.4% below. Policies need to be implemented in a way that preserve jobs. Protecting the rights and opportunities of workers to earn a living is obvious. Equally important are the psychological benefits that come with the dignity of work. And there are socio-economic benefits from work that positively impact everyone, such as building social capital and gaining skills, which are especially important for those in marginalized communities who were most impacted by the pandemic. As the states prepare to deal with the Omicron variant (and we’re sure there are more to come), it is paramount that they consider the empirical evidence and not impose burdensome restrictions—such as business closures, stay-at-home orders, school closures, gathering restrictions, and capacity limits—on economic activity that will likely end up doing more harm than good. Instead, the policies need to be crafted more carefully to expand opportunities for the poor and preserve jobs in an open economy in which entrepreneurs can solve problems while taking measures when necessary to protect vulnerable populations. These are the policies that should have been done all along to avoid the severity of the shutdown recession and the effects on lives and livelihoods thereafter. Let’s not make another mistake when so many are already suffering. Mr. Randolph who authored the study, is the Director of Research for the Georgia Center for Opportunity. Mr. Ginn, who sat on the advisory panel for the study, is chief economist at the Texas Public Policy Foundation, served as associate director for economic policy at the White House Office of Management and Budget, 2019-20. https://www.texaspolicy.com/with-the-omicron-variant-here-states-must-avoid-past-mistakes/ History repeats itself, and at milestone intervals.
It was 100 years ago that President Warren Harding called for a return to normalcy. His vice president and successor, Calvin Coolidge, prickled at this loose expansion of the English language, but agreed with the sentiment. After a series of traumatic events for the nation, including the Spanish flu pandemic, Harding knew that the nation needed to return to normal, starting with the government. In 1921, he called for a series of reforms which sound like they were written for 2021—cut government spending, cut taxes, and stop inflation. Government spending is now, as it was then, out of control. Federal spending increased by 89% during the pandemic and its share of America’s private sector output has skyrocketed to 45%, the highest since World War II before the latest shutdown recession. Despite tax receipts being at a nominal all-time high, the federal government is running record-breaking $3 trillion deficits with little help in sight. Governments at all levels in the U.S. are now taking 34% of our private economy. This means that every year we work from Jan. 1 to May 4 just to pay our taxes. Meanwhile, inflation is also getting out of control. It is not only high, but accelerating. At the current rate, prices will double in less than 14 years. And yet wages are moving in the other direction. While the general price level in June rose 5.4% from one year prior, average hourly earnings in the private sector adjusted for inflation fell 1.7%, hurting families’ purchasing power. Harding faced similar problems in 1921—government spending had ballooned because of World War I, taxes were punitively high, and the Federal Reserve (Fed) had caused rampant inflation. And yet, the Harding administration turned it around quickly. In the summer of 1921, exactly 100 years ago, Harding spoke using words that sound like they were written for today: “There is not a menace in the world today like that of growing public indebtedness and mounting public expenditures,” he said. “There has seemingly grown up an impression that the public treasuries are inexhaustible things, and with it a conviction that no efficiency and no economy are ever to be thought of in public expense. We want to reverse things.” A good first step in reversing things would be to control the growth in government spending with passage of the Foundation’s Responsible American Budget. This fiscal rule limits spending growth to a maximum rate of population growth plus inflation to keep federal expenditures below the average taxpayer’s ability to pay for them. This needed restraint would help curtail spending. Further cuts can then be made, targeting handouts that disincentivize work and welfare that traps people in poverty. To provide tax relief at the federal level, Washington should cut marginal tax rates. After Harding and Coolidge cut tax rates, tax revenue increased. The same phenomenon occurred when JFK, Reagan, Bush, and Trump cut tax rates, too. States should also move to cut taxes—and several states have already done so. Texas, with an abnormally high local property tax burden, should enact reforms to drastically reduce property taxes that are quite literally forcing Texans out of their homes. To stop inflation, the Fed just needs to do what it did a century ago: It must stop furiously expanding the money supply. Like it did in WWI, the Fed is currently acting as the financing arm of the radical growth in federal spending by purchasing a large share of government bonds—that should stop. The Fed also needs to return to its mission of price stability via a monetary rule, and nothing else. This means an end to targeting full employment and to engaging in social engineering, and a start to a monetary rule. The effect of Harding’s and Coolidge’s reforms in the 1920s was a booming decade so prosperous that it resulted in the Roaring Twenties. The government ran a surplus and retired debt for every year of the decade. In the 1930s, the bad policies of the Hoover and Roosevelt administrations and associated Fed policy caused and prolonged the Great Depression. If the nation implements similar reforms as those from a century ago, instead of the Biden administration’s proposals, then America can repeat her previous success. Reining in misdirected fiscal and monetary policy will bring a return to normalcy, so that we can let people prosper again. Commentary The Texas Public Policy Foundation’s Chief Economist Vance Ginn and economist E.J. Antoni break down the massive spending proposals in President Biden’s recent address to Congress.
$225 billion toward high-quality childcare and ensuring families pay only a portion of their income toward child-care services, based on a sliding scale Raising taxes from one pocket to put money in the other is just shuffling dollars. The subsidies will also increase the overall cost of child care for those who need it. $225 billion to create a national comprehensive paid family and medical leave program Americans should be free to negotiate compensation packages like paid leave as they see fit; it shouldn’t be dictated by a bureaucrat. The consequence of a government-mandated paid family and medical leave will be lower wages and less opportunities for those with less skill and experience. $200 billion for free universal preschool for all 3- and 4-year-olds, offered through a national partnership with states Parents want valuable schooling options for their kids, especially during critical years of early development, not rhetorical fallacies that something is free. Instead of creating another spendthrift program with a profligate bureaucracy behind it that will reduce the quality of preschool like government has to K-12 education, government should focus on removing imposed barriers of high taxes and marriage penalties that reduce parents’ resources to meet their child’s unique needs. $109 billion toward ensuring two years of free community college for all students College, including community college, is not always the right fit. Some people enter trade or technical schools or begin their careers right after high school. This is especially true among those with lower lifetime earnings. “Free” college programs just take tax money from those with lower earnings to pay for the tuition of those who will likely have higher potential lifetime earnings. Government-guaranteed funding for higher education will also further inflate costs and reduce quality as things are rationed without market prices. About $85 billion toward Pell Grants, and increasing the maximum award by about $1,400 for low-income students Pell Grants, like many subsidies for higher education, benefit school administrators more than students. As subsidies increase, so does tuition, and so do administrative costs. Students eligible for Pell Grants often take out student loans to cover the remainder of their education expenses and they graduate with heavy debt burdens. To help make higher education more affordable, government should remove demand subsidies and supply restrictions, forcing schools to compete for students by slimming down their bloated administrative departments and by increasing access to lower tuition. A $62 billion grant program to increase college retention and completion rates There is no evidence that a lack of funding is causing retention problems at colleges and universities. There is, however, substantial evidence that low-quality government-run primary and secondary schools have failed to provide students with the knowledge and skills to succeed at the college level. The solution is not more government spending, but more educational choice throughout the education system. A $39 billion program that gives two years of subsidized tuition for students from families earning less than $125,000 enrolled in a four-year historically Black college or university, tribal college or university, or minority-serving institution Subsidies in higher education is what’s leading to the rapid increases in tuition, so doubling down on that is poor policy rather than finding ways to increase competition and lower prices while improving quality. $45 billion toward meeting child nutritional needs, including by expanding access to the summer EBT program, which helps some low-income families with children buy food outside the school year This is another government program that is fraught with waste and inefficiency. We would do better to lift burdensome regulations and taxes off the backs of small business, stimulating development, investment, and job growth. A parent with a well-paying job can afford to feed his or her own children. $200 billion to make permanent the $1.9 trillion COVID-19 stimulus plan’s provision lowering health insurance premiums for those who buy coverage on their own This sounds like a subsidy for those buying health insurance, but it is actually a subsidy for the insurance companies. After the implementation of the Affordable Care Act, which would supposedly reign in profits of the insurance companies, those profits reached record highs. People want more choices for healthcare, not handouts to insurance companies. Extending through 2025, and making permanently fully refundable, the child tax credit expansion that was included in the COVID-19 relief bill As Ronald Reagan said, nothing is so close to eternity as a temporary government program. The justification for transitory COVID-19 relief was the pandemic, which is now far past its peak as we approach herd immunity. There is no reason to continue these temporary relief measures going forward. Making permanent the recent expansion of the child and dependent care tax credit These tax credits are accomplishing the opposite of the bipartisan welfare reforms of the 1990s. Instead of rewarding work, they reward idleness. These government handouts will serve to trap people in a cycle of poverty and dependency. Making permanent the earned income tax credit for childless workers This is another example of a government program taking on a life of its own. The American Rescue Plan Act (ARPA) tripled the credit and gave benefits to childless workers that were previously reserved to working parents. The justification for this ill-conceived measure was the temporary hardship from government-imposed lockdowns; there is no reason to make them permanent but rather open their economies so people can find jobs and prosper. The effect of these government handouts is to keep people in low-wage jobs because the tax credit is quickly phased out as income rises. Once again, these programs cause dependency on government instead of letting people prosper. https://thecannononline.com/president-bidens-terrible-horrible-no-good-very-bad-ideas/ A recent Wall Street Journal article highlighted the devastating mental health effects of the pandemic on children. Kids have been subjected to stifling lockdowns even though there has been overwhelming evidence that children are at low to no risk of experiencing severe symptoms or transmitting COVID-19. While the article is certainly correct to emphasize the terrible state of America’s youth, it wrongly places the blame—the pandemic did not do this to our children. Government-imposed lockdowns did.
Isolation has taken its toll on everyone, but most especially the very young and very old. A study conducted at a pediatric emergency department in Texas found that suicide ideation among 11- to 21-year-olds as well as suicide attempts are up significantly from 2019. Mental health-related emergency department visits for minors jumped 11.3% in the first quarter of 2020 and then another 44.1% through October 2020. Remote learning has negatively affected the mental and emotional health of one in four children. Instead of normal, healthy human interaction, children have been left to their own devices—literally. These include phones, tablets, gaming consoles, and computers, all of which are poor substitutes for human relationships and interpersonal connections. But the toll on children goes beyond deteriorating mental health and retrograding social skills. Children are falling behind in the classroom, especially in math. Remote learning and so-called hybrid learning have proved a poor substitute in educating many of the young. Almost half of parents in a study of low-income families reported experiencing food insecurity. Given the sky-high unemployment caused by government-imposed lockdowns, this is not surprising, especially because low-income earners were more heavily affected by this forced unemployment. Parental angst due to economic issues adds to a child’s already increased anxiety. Like the isolation imposed on children, the source of the nation’s unemployment also has not been a virus, but government-imposed lockdowns. The proof of this is the comparison between states that implemented lockdowns and those that did not. The lowest unemployment rates are found in states that have essentially returned to normal, or never imposed restrictions in the first place. The highest unemployment rates are found in states that implemented the harshest lockdowns. While the tightest lockdowns were all in Democrat-run states, this is not strictly a political issue. Among all Republican trifecta states, (where Republicans control the entire legislature and the governorship) Texas has the worst unemployment, as Texas imposed some of the tightest and longest restrictions. Texas must now catch up to states like South Dakota and Florida, which both returned to normal long before Texas. Just as unemployment has been highest in states with harsher lockdowns, school closures have been the worst in those same states. And yet, despite the severe costs which the lockdowns have imposed upon children, those lockdowns were seemingly ineffective at slowing the spread and reducing the death rate of COVID-19. (New cases and deaths in Texas are continuing their downward trend since the statewide mask mandate was lifted on March 10.) In fact, the chart below shows a slightly positive, although statistically insignificant, relationship between government-imposed lockdowns and state death rates. In contrast, there is a strong relationship between the severity of government-imposed lockdowns and both school closures and state unemployment rates. Unsurprisingly, the states that forced businesses and schools to close suffered, and continue to suffer, the highest unemployment. So, while the government-imposed lockdowns failed to achieve their primary stated objective, those lockdowns succeeded in crashing the best economy in half a century and inflicting our children with low-quality educational experiences and mental-health afflictions. Sadly, even after the government-imposed lockdowns end, children are more likely to have depression and anxiety because of this artificial isolation. The lockdowns were a mistake, but where do we go from here? First and foremost, we need to return to normal, and not some kind of Orwellian “new normal.” Families need to be allowed to practice personal responsibility rather than be told how to act by politicians or bureaucrats. Second, our children will need more mental and emotional support, which starts with healthy and robust families, and is buttressed by private organizations (both for-profit and non-profit) that cater to these family issues at the local level. Finally, this last year has been a massive case study demonstrating why educational freedom is essential. Giving parents more options in how their children are educated is a powerful way to improve educational outcomes because of the competition that arises when students are not forced to attend a particular school but rather choose one that meets their unique needs. None of these strategies involve growing government or bureaucracy. In fact, they involve limiting or reducing the roles of governments by strengthening institutions and freeing local communities to help children and families prosper. And given how far many children have fallen behind in the last year, they need all the help we can give them. https://thecannononline.com/lockdowns-hurt-our-kids-futures/  COVID-19 continues to take a toll in the U.S., with more than 13 million cases and over 260,000 deaths. The rise in cases has led to interventions by state governments.
Given that the health threat is real, we should learn from what has worked —and what has not. That means we must work hard on a vaccine, protect the vulnerable, and let most people live their lives. Michigan, New Mexico, Oregon and Washington have closed most businesses. New Mexico has issued a shelter-in-place order. Other states have started mandating masks. Some Texans are pushing for more interventions even as we’ve had a statewide mask mandate since July 2. While these interventions are well-intended, blanket and indefinite policies simply aren’t warranted. Such policies have already cost millions of jobs. During the lockdown that started in March, many Texans’ livelihoods suffered a devastating blow. The state’s economy contracted by a record 29% on an annual basis in the second quarter of 2020. This contributed to at least 8,900 shuttered businesses, losses of 1.3 million jobs in the private sector, and an unemployment rate that skyrocketed to 13.5% through April. In a survey taken at the end of May, 16% of Texans said they were facing financial ruin, and 22% said it would take them a year or more to recover. These figures likely have worsened since then. After reopening some businesses in May and then reversing course over the summer, Gov. Abbott changed the method for assessing how and when to expand capacity at certain business venues. The new system—considering COVID-19 hospitalizations as a share of hospital capacity in each of 22 trauma service areas — allowed a more targeted, timely, and temporary approach. And it reflected the intent of the initial lockdown response to “flatten the curve” so hospitals wouldn’t be overwhelmed. If a trauma service area has a rate for seven straight days in which less than 15 percent of total hospital capacity has been COVID-19 patients, then most businesses there can expand from 50% to 75% capacity. Currently, 94% of Texans are in areas that can be at 75% capacity—contributing to more economic activity. But state totals of COVID-19 cases and hospitalizations have been at or near their highest since the pandemic started. This has initiated calls by the Statesman’s Editorial Board for people to act responsibly, for a new path in Texas’ response that has been “marked by high hopes and half measures,” and for a “serious national strategy.” But Gov. Abbott rightfully said lockdowns are off the table: “Our focal point is going be working to heal those who have COVID, get them out of hospitals quickly, make sure they get back to their normal lives,” he said. With several vaccines getting closer to being available and with Pfizer announcing a pilot program to deliver the vaccine quickly in Texas, there is no reason for a lockdown. Let’s acknowledge we can’t get to zero cases and deaths without eliminating liberty and livelihoods, and let’s better allocate our efforts in a targeted, temporary, and timely way until the vaccine is readily available and population immunity occurs. https://www.texaspolicy.com/governments-cure-shouldnt-be-worse-than-covid-19/ 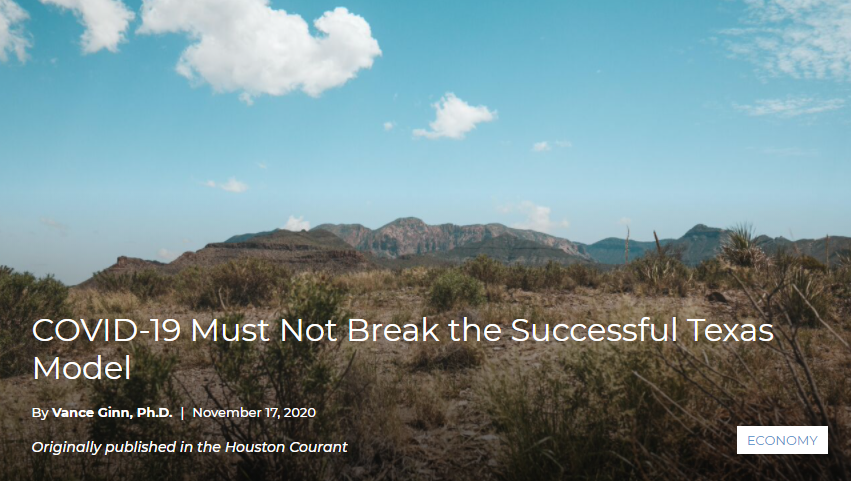 Shutdowns and stay-at-home orders across Texas due to COVID-19 have spiked unemployment, slowed tax receipts, and forced the permanent closure of 8,900 Texas businesses since March. This, from one of the most dynamic and fast-growing economies in the world.
A return to previous success is possible, and necessary, by safely reopening Texas and promptly strengthening its institutions. The Texas Model of relatively limited government, along with the pro-growth policies of the Trump administration, provided an institutional framework that helped create an attractive economic environment to let people prosper. In 2019, Texas led the nation with GDP growth of 4.4% and with the most jobs added of nearly 350,000 (and the fourth-fastest growth rate of 2.7%). Also, Texas had the lowest supplemental poverty measure rate of 13.7%, (the SPM accounts for cost of housing differences across the nation and other key metrics), compared with other large states of New York (14.4%), Florida (15.4%), and California (17.2%)—the highest in the nation. In addition, the Texas model was strengthened by a voter-approved constitutional ban on a personal income tax last year, property tax relief through reform and reductions, and a track record over the last three sessions of passing conservative budgets. But these benefits couldn’t withstand the economic destruction of fear. Fear led the public to decrease their interactions early on during the COVID-19 pandemic, before state and local governments created a whiplash of openings and closures with questionable results. At the state level, Texas Gov. Greg Abbott issued a disaster proclamation on March 13, near the start of the pandemic, and then a stay-at-home order on March 31. Some restrictions were lifted on April 17 and more were eased a couple of weeks later before another the rise in COVID-19 cases and positive tests—both have been questionable measures to consider when making policy— over the summer raised concern, resulting in a statewide mask mandate and further restrictions. This sort of uncertainty makes it practically impossible for entrepreneurs to run a business or for job-seekers to find steady employment. The recently released GDP by state figures for the second quarter of 2020 accounted for this destruction. Dealing with a U.S. economy contracting by an annualized rate of 5% in the first quarter and 31.4% in the second, Texas’s GDP shrank by a record-breaking 29% in the second quarter. But this put it in the second quintile of best-performing states, if contracting at a record annual pace can be considered “best,” with less loss than Florida (-30.1%), California (-31.5%), and New York (-36.3%). While the third quarter growth improved dramatically across the U.S., the same is true in Texas as some restrictions were eased. And on Sept. 17, Texas changed the metric used to evaluate the situation to COVID-19 hospitalizations as a share of all hospitalized patients, which aligns with the initial reasoning for government overreach to avoid overwhelming hospital capacity. This allowed some trauma service areas (TSA) with that metric below 15% for seven consecutive days to open most businesses to 75% capacity. Then, on Oct. 7, a new Executive Order was issued that changed the metric to COVID-19 hospitalizations as a share of total hospital capacity, an improvement that better accounts for the flexibility that hospital managers have with beds. This order also expanded most businesses capacity to 75% in TSAs with less than 15% of this metric and allowed bars to open to 50% capacity—assuming a county’s judge approves it, which hasn’t been the case in most large urban counties. The new metric results in only three (Amarillo, Lubbock, and El Paso) of 22 TSAs with a hospitalization rate above 15%, as of Nov. 9, meaning that 94% of Texans can have access to 75% of certain business capacity. As COVID cases rise once more during flu season, calls for a second round of harsh restrictions are sure to happen. What these demands fail to understand is that the re-opening measures in place are not due to a blind indifference to human suffering, but rather a different, better path to evaluate tradeoffs. In addition, the catastrophic drop in GDP across the state was due in no small part to the swinging pendulum of shutdown to rollback to shut down again, with unemployment rising to a historically high 8.3%. Another statewide shutdown would deal another staggering blow to an economy recovering from the fallout of the pandemic. The Texas Model was responsible for the economic boom before the pandemic, and what comparative success we’ve had during the COVID-19 crisis was due to efforts to roll back restrictions in line with that model. If the state is to fully recover, the next steps to do so must be made clear soon as without it the uncertainty and fear will contribute to more job losses and the demise of the once successful Texas Model. https://www.texaspolicy.com/covid-19-must-not-break-the-successful-texas-model/ Watch my presentation “Was the Cure Worse than #COVID19?” This presentation is part of the Free Market Institute at Texas Tech University's Public Speaker Series, where I explain the economics of how institutions, tradeoffs, and policy matters when dealing with this situation. You can also view my slides below. 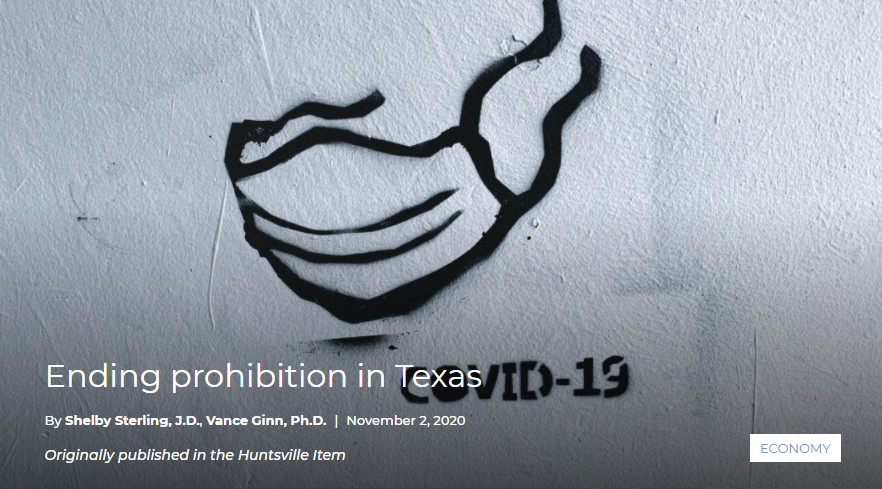 Americans want to return to work after months of joblessness due to the COVID-19 pandemic-related business closures. But too many Texans can’t—because of the industry they work in.
There was some hope that this might change after Gov. Greg Abbott’s executive order that took effect on Oct. 14 expanded the state’s reopening plan by adding bars to the list of certain businesses allowed to partially open. But one of the stipulations in the order to open bars to 50% capacity is already proving hardest to overcome: gaining the approval from the county judge. Despite low COVID-19 hospitalization rates in most of the 22 trauma service areas across the state, many bars do not have the judge’s approval they need to open. This limitation—among others—hits many Texans while they’re down. For example, Texas’s 8.3% unemployment rate in September is historically high and substantially higher than the near record-low rate of 3.5% in February before the COVID-19 pandemic. Under the latest order, fewer restrictions are placed on those areas that are below the 15% threshold metric of COVID-19 hospitalizations as a share of total hospital capacity for at least seven consecutive days. These areas can have most businesses expand to 75% capacity and allow bars to open to 50% capacity with the approval of the county’s judge. But if an area’s metric is above this 15% threshold for seven straight days, then certain businesses are rolled back to 50% capacity and bars must close. Fortunately, this order allows a more targeted policy approach to focus public and government assistance on populations that need it most. The chosen metric also helps bring a more objective measure that’s less susceptible to manipulation—intentional or otherwise—while supporting the government’s initial argument for preventing COVID-19 from overwhelming hospitals. While this is an appropriate and safe step towards opening Texas, uncertainty remains for employers and workers who are left in the dark without a timeline for when the state will be fully open. In other words, when will Texans have their freedoms back so that they can live out their dreams responsibly? This sort of certainty is what will help give people a sense of calm in this storm and support a more vibrant economy that will lead us back to a robust situation like we had in February. Adding to the current uncertainty, local officials are making bad decisions by refusing to rely on the evidence. Specifically, many of the major county judges insist that the threat levels are still too high for any further reopening efforts. But the data indicate otherwise. In fact, as of Oct. 27, most areas where 94% of Texans reside are maintaining a hospitalization rate below 15% with only the three trauma service areas that include El Paso, Amarillo, and Lubbock on the restricted list. The evidence did not stop the counties of Dallas, Harris, and Travis from firmly putting their feet down when it comes to reopening bars. Judges in Dallas and Harris counties quickly announced their rejection of opting into the order despite their preceding seven-day COVID-19 hospitalization rate at that time holding steady around 8% and 4%, respectively. Dallas and Houston are not alone. The Travis County judge, which houses the state’s capitol in Austin, announced its intention to keep bars closed until further notice. Its preceding seven-day average was even lower than Dallas and Houston, running below 3%. In fact, the Austin area’s rate has been below the Governor’s 15% threshold since July 22. With numbers this low and personal responsibility in place, why shouldn’t bars and similar businesses be allowed to open? Failing to rely on the data when making life-altering decisions demonstrates that these decisions are not based solely on the health, safety, and livelihoods of Texans. If they were, Texas would be further along to fully opening, and Texans could live their lives more freely. The evidence supports further reopening and local officials would do right by Texans to allow it. One thing is clear: Texans want to get back to normal. https://www.texaspolicy.com/ending-prohibition-in-texas/ Texas economist explains benefits of Trump's executive orders for COVID-19 unemployment relief8/19/2020 President Donald J. Trump recently signed four executive actions in response to a congressional stalemate on the next round of COVID-19 relief, drawing praise from a Texas economist.
Texas Public Policy Foundation (TPPF) Chief Economist Vance Ginn provided brief overviews on the use of federal Disaster Relief Funds (DRF) to boost state unemployment insurance funds, the payroll tax issue and enhanced unemployment insurance. “The goal of President Trump’s four executive actions on Aug. 8 is to provide financial assistance at a time when Congress hasn’t acted to help struggling families due to the disruptions caused by COVID-19,” Ginn wrote. “Currently there is uncertainty regarding these actions that could weigh on employer and employee decisions until further clarity is provided. While these actions may increase uncertainty that hinders economic activity, they can help American families in the short run by providing additional aid until state and local governments, hopefully soon, safely fully reopen society.” TPPF Chief Economist Vance Gin | Photo courtesy of the TPPF Ginn offers an informed perspective, having recently served more than a year as the associate director for economic policy for the Office of Management and Budget (OMB). His role was to advise the OMB’s director on economic and fiscal policy matters, manage a team that sought evidence of good government and modeled the economic assumptions in Trump’s fiscal-year 2021 federal budget, which proposed a record of $4.6 trillion in cuts to the national debt over a decade. Ginn said the Aug. 8 executive actions do not increase the deficit directly. “The $44 billion for the federal enhanced unemployment insurance is paid from the funds available in FEMA’s disaster relief fund," he said. "And the deferral of payroll taxes is just a deferral so doesn’t add to the deficit unless Congress forgives those taxes through legislation later. Also, the Social Security Trust Fund won’t take a hit as money will be transferred from the General Fund to it until the payroll taxes are paid or forgiven, which is what happened after the 2010 tax bill under the Obama administration cut the payroll tax by 2 percentage points. "Regardless, there is a need to get businesses operating and workers working again by reopening society so problems related to the lives and livelihoods of Americans along with our fiscal solvency aren’t put further at risk.” Ginn said Trump's moves could put more money in taxpayers’ pockets as well as helping people find jobs as state and local governments loosen their lockdowns. “This could happen by deferring the payroll taxes and employers not withholding it to possibly pay it later and then by the $300 per week in enhanced [unemployment insurance] not being so high that 68% of Americans who make less than the $600 per week previously provided,” he said. “Again, the key is to get businesses operating again and for workers to be connected to a job that will help to increase economic activity on the supply side that is critical for us to have a stable and strong recovery.” Ginn said that more can — and must — be done to speed economic recovery. “Families across America are struggling from being unemployed and being uncertain whether they can keep their business open or when they will get a job or be called back,” he said. “In order to help the American people, we need accurate and reliable COVID-19 data that includes timely demographic information to understand more about its contagion and effects so hospitals aren’t overwhelmed and vulnerable populations are assisted with necessary resources as governments reopen society for everyone else. Along with that, there is a need to rightfully provide funding to businesses that were stripped of their resources from governments during lockdowns.” The TPPF supports a targeted, short program called the Workplace Recovery Act, which covers businesses‘ net operating losses so they can keep workers onboard and rehire others until this lockdown situation is over. “Fortunately, Congress could reauthorize the available $1.3 trillion from its other already passed legislation for this program and scrap the rest of the measures under consideration that aren’t targeted or timely,” Ginn said. “In addition to state and local governments reopening society and Congress passing the Workplace Recovery Act, there is a need for governments to get their budgets under control by reducing wasteful spending so that this redistribution of incomes through the government sector doesn’t further slow economic activity. “Another thing is ending unnecessary regulations, particularly those that were suspended during the lockdowns,” he continued. “By following this approach, American families can have some calm from increased certainty about their future during a chaotic time, which is what the president seems to be trying to provide even as Congress does its best to make the situation worse.” Ginn earned his doctorate in economics at Texas Tech University and has taught at Texas Tech and Sam Houston State. He joined the Texas Public Policy Foundation in 2013 and worked there until joining the Trump administration in 2019. He returned to the foundation in May. Ginn said his goal at the TPPF is to preserve the state as a place where Texans can build their careers, raise their families and live their lives freely. https://lonestarstandard.com/stories/548530015-texas-economist-explains-benefits-of-trump-s-executive-orders-for-covid-19-unemployment-relief#.Xz2ZjJo4Ogs.twitter Until now, governments in America have never shut down society like they did due to COVID-19. Unfortunately, the destruction by the novel coronavirus and the lockdowns have devastated lives and livelihoods.
But we must consider not only the effects we can see such as the number of cases and deaths reported, but also the unseen effects of government action, such as sidelining entrepreneurs to solve problems. There’s no doubt that daily reports of (often flawed) COVID-19 data and the responses by government have elevated fear among us. But what’s worse is that the lockdowns have substantially limited our Creator’s design for us to be social, and sidelined entrepreneurs’ ability to conquer this disease. The first is self-explanatory. Even if you don’t believe in a Creator, the evidence of the harm lockdowns have caused or contributed to is heartbreaking. There’s evidence that the situation has resulted in increased suicides, more cancer deaths, worsened mental health, and elevated cases of severe child abuse. And as many businesses closed their doors, Yelp reports that more than half won’t reopen. Less business activity has contributed to GDP growth in the second quarter likely contracting by a record pace, 12 million more people unemployed, and many Americans on welfare programs. The psychological and economic tolls this Great Disruption is having on Americans will be long-lasting. We need a proven path that safely deals with the real issues surrounding COVID-19 while allowing us to be social and conquer the disease more quickly. We must put entrepreneurs back in the game. The entrepreneurial spirit is unlocked in our typical system of free enterprise with limited government intervention. This spirit creates a process of risk and discovery through profit-loss that has created breakthroughs by entrepreneurs in conquering fear and improving lives and livelihoods. Just think about how this system has benefited people across the globe by eliminating many infectious diseases, largely eradicating famine, and substantially reducing poverty. These include allowing the U.S. to overcome the Spanish flu in 1918, the diphtheria peak in 1921, polio outbreaks in 1916 and 1952, and swine flu in 2009 without governments locking us down. That allowed entrepreneurs in health care and elsewhere to design innovative ways to overcome these obstacles. We’re told this time is different, so more severe restrictions were necessary. While possibly necessary for the elderly and the vulnerable, it’s questionable for everyone else. For example, Stanford University’s disease prevention chairman Dr. John Ioannidis said, “For people younger than 45, the infection fatality rate is almost 0%. For 45 to 70, it is probably about 0.05%-0.3%. For those above 70, it escalates substantially.” By allowing fear from COVID-19 headlines to drive government decisions instead of the full context of the situation, we lose many opportunities to improve our world. Entrepreneurs are trying to conquer our fears despite the draconian government policies. They have done this at the businesses we all frequent by helping to reduce the virus’ contagion including using Plexiglas dividers in stores, requiring masks for entry, and creating stickers to help with social distancing. Their innovation has been alive and well at restaurants by expanding the use of mobile ordering and even food delivery robots to keep selling their foods. There are many more finding therapeutics and ultimately a vaccine. But these extraordinary measures to deal with COVID-19 are just the tip of the iceberg to what human ingenuity could bring if our entrepreneurial spirit is allowed to thrive. But governments have been using political calculations to address a problem they can’t do well, if at all. Governments don’t work well in a crisis. They are short-sighted and wrongly impose one-size-fits-all policies that often fit very few. The same is true this time around with universal masks, lockdowns for everyone, or closings of specific businesses rather than focusing on protecting the vulnerable populations. Not opening government schools to in-person instruction would make the situation worse. That’s why many parents are seeking alternatives, such as informal school “pandemic pods” and homeschooling. Let’s give entrepreneurs (meaning all of us) the opportunity to seek solutions to the COVID-19 situation as we have many times before, so that we will have increased liberty, more calm, and greater flourishing. https://www.houstoncourant.com/houston-voices/2020/let-entrepreneurs-solve-covid-19 Most signs point to an improving COVID-19 situation in Texas—unless you consider the recently questionable elevated test positivity rate that’s keeping us from reopening.
On Aug. 13, Texas reported 6,879 hospitalized COVID-19 patients statewide, the lowest number since June 30. And on that day, the Texas Medical Center in Houston had its 27th consecutive day of decline of the seven-day trend of daily COVID-19 patients hospitalized, with the average of hospitalizations being almost half of their peak. Texas’s seven-day average of new daily COVID-19 cases on August 13 was 38% off its July 14 peak. Those are good signs but Texas’s testing positivity rate, the share of those tested for COVID-19 who test positive, surged to a seven-day average rate of 24.5% on Aug. 11. That’s well above the 10% rate that Gov. Greg Abbott has indicated the state needs to consistently maintain for bars and other shut-down businesses to reopen, and for capacity restrictions to be eased. Dr. Ashish Jha, Professor of Global Health at Harvard, has suggested that “the outbreak in Texas may actually [have been] getting worse over the last week or so.” And the skyrocketing test positivity rate sparked a call by Gov. Abbott to bring in a special “data team” to examine what’s going on in the Lone Star state, which the positivity rate surprisingly fell by 8.4 percentage points that day to 16.1%. But more context shows that Texas may be on the road to recovery—but is being held back by a dysfunctional data reporting system that obfuscates reality and distorts policy choices. A recent analysis indicates that testing for COVID-19 remains on the upswing in most Texas counties, leading to a discrepancy between county and state data. The culprits for this discrepancy are tests labeled as “pending assignment,” which once numbered over a million but have decreased to roughly 476,000 as of Aug. 13. Tests marked as “pending assignment” are recorded by the Texas Department of State Health Services but have not been assigned to a county. Previously, unassigned cases had been included as part of the state’s test rate calculations, but this appears to have been changed around July 31, when reported tests began to decline. Furthermore, it’s not clear which date the state records to a test when they assign it to a county, resulting in new data illustrating a sharp increase in the test positivity rate when the outbreak seems to be improving. Moreover, Gov. Abbott has suggested that the closure of some of the temporary testing sites in July may have influenced the figures. And testing centers in Austin and other areas were recently only testing symptomatic people. It is commendable that the state is working to make its data as accurate as possible. But this effort lacks transparency, and that lack of transparency comes at a cost. The possibility exists that demand for COVID-19 tests has declined from what’s been called “COVID fatigue,” but the state’s data don’t make that clear. Collectively, simple fractional math shows how some combination of these factors would contribute to driving up the positivity rate. Not only could this data create unnecessary fear among Texans (and reinforce the mainstream media’s panic-oriented narrative), it could also hamper efforts to revive the Texas economy. While many Texas businesses have been permitted to reopen or restart at limited capacity (allowing the economy to begin its long road to recovery), bars are still suffering from the effects of the lockdown. This has also forced about 1,500 restaurants, which employ roughly 35,000 people, to close because alcohol sales exceeded 51% of their total revenue. The implications extend beyond bars, as the flawed test positivity rate reporting influences general capacity restrictions, outdoor gatherings, and mask mandates, along with the reopening of schools and professional sporting facilities. For Texans, lockdown orders are more than just policy decisions; they can determine the fate of our lives, livelihoods, and the futures of our children. Texas shouldn’t determine reopening guidelines based on flawed metrics. Texas has worked to conquer COVID-19, and it deserves a data reporting system that accurately represents the facts. This would help direct targeted policies, instead of blanket ones, to help vulnerable populations so we can safely reopen. Otherwise, Texas risks permanent economic and health damage, not just because of the pandemic itself, but also because of bureaucratic inefficiencies within the state’s data reporting system. https://www.houstoncourant.com/houston-voices/2020/texass-covid-19-testing-conundrum On Saturday, August 8, President Trump signed four executive actions in response to a Congressional stalemate on the next round of COVID-19 relief. This brief covers the memorandum deferring some employees’ payroll taxes to Social Security without affecting the program.
Background on payroll taxes: There are two types of payroll taxes: Social Security rate is 12.4% on wages capped at $137,700—half is paid by the employer, half is paid by the employee (though employers typically pass on this tax in the forms of lower wages and higher prices). Medicare rate is 1.45% for both the employer and employee with no wage cap. Employee payroll taxes are withheld by employers and paid on their behalf. The CARES Act (March) deferred payments of employer payroll taxes until either 2021 or 2022. Details of the August 8 memorandum on deferring payroll taxes to Social Security: Defers employee payroll taxes to Social Security from September 1 to December 31or until an unspecified later date, without penalty, interest, or additional tax. Applies only to those earning before tax less than $4,000 biweekly ($104,000 annually). Requests that the Secretary of the Treasury “explore avenues, including legislation” to permanently eliminate these deferred payroll taxes. The stated intention of this action are to: “put money directly in the pockets of American workers” “generate additional incentives for work and employment” Economic effects questionable from increased uncertainty & fiscal effects are uncertain: This is effectively a no-interest loan from the government (i.e., taxpayers) to workers, with uncertainty about if, and when, it will be repaid. The change doesn’t affect incomes for unemployed workers and may not increase disposable incomes of employed workers who will likely save any income increase or the employer with withhold the funds to eventually repay the payroll taxes, unless they’re forgiven by Congress. The action could add about $150 billion to the FY21 budget deficit, which weighs on the economy, depending on whether Congress cuts the payroll taxes owed, as funds will be transferred from the General Fund to cover the reduction in payroll taxes to Social Security. There is much uncertainty from the memorandum by employers about how they will handle the employee payroll tax deferral. It’s not clear when the deferred taxes are due or how they will be paid (directly by employees or through employers). These questions should be resolved soon, as Secretary Mnuchin recently indicated employers can choose whether to withhold the taxes. The memorandum doesn’t change the cost of hiring employees, so it will not increase the number of jobs available. That is inherently constrained by limited business activity from government-mandated lockdowns. Recommendations to improve the economy and the livelihoods of Americans: Safely reopen society by ending state and local government-mandated lockdowns. Get businesses operating and workers working again, such as with TPPF’s Recovery Act. Eliminate wasteful programs to rein in excessive government and end unnecessary regulations. https://www.texaspolicy.com/overview-of-executive-action-on-deferring-employee-payroll-taxes/ On Saturday, August 8, President Donald Trump signed four executive actions in response to a Congressional stalemate on the next round of COVID-19 relief. This brief covers the memorandum allocating federal Disaster Relief Funds (DRF) to enhance state unemployment insurance (UI).
Background on UI: The federal-state UI system was created in 1935 as a form of social insurance run by—and usually funded by—states from collected business taxes, with the Department of Labor overseeing it. Most states typically fund UI at half of lost wages for about 26 weeks while workers search for jobs (Texas requires the unemployed to report applying for at least 6 jobs per week). The federal government can provide extended UI for 13 or 20 weeks longer and split that cost with states. However, the 2009 American Recovery and Reinvestment Act was the first time the federal government covered it all and lasted until 2013 when extended UI was provided for up to 99 weeks. Congress passed the 2020 CARES Act that included federal funds for enhanced UI of $600 per week until July 31. Separately, the federal Pandemic Unemployment Assistance program extends the UI period for 13 weeks, for a new maximum of 39 weeks. Economists find that 68% of eligible workers received enhanced UI greater than their lost earnings. Other economists highlight how high unemployment benefits can encourage layoffs, discourage work, and delay productive economic reallocation. Details of the August 8 memorandum that provides enhanced UI by the federal government: Directs up to $44 billion from the Federal Emergency Management Agency’s (FEMA) Disaster Relief Fund (DRF) to fund enhanced UI. Offered $300 per week in enhanced UI if the state increased their UI by $100 per week. This requirement was then clarified so that an unemployed person could receive the enhanced UI if they already receive at least $100 per week from the state UI. Enhanced UI terminates for work weeks ending on December 6, 2020 or when funds run out, whichever occurs first. An estimate predicts funds could run out after about five weeks. Economic effects are minimal until an end to lockdowns & fiscal effects are neutral given DRF: Fiscally neutral because money is in the DRF but would change if natural disasters occur this year (e.g., hurricanes) requiring more than $25 billion in spending—the amount retained in the DRF. Federal enhanced UI is now tied to state UI if an eligible person receives more than $100 per week from the state UI. An economist estimated that nearly 1 million unemployed people currently receive below $100 per week so wouldn’t get the extra $300 per week. Enhanced UI payments won’t start until at least late August, meaning many people who were dependent on the new total UI will receive only the normal state UI. The decline to the historical amount of the state UI could help incentivize people to search for work during or after lockdowns. There’s evidence that enhanced UI may not have discouraged searching for work because jobs have been limited during lockdowns, so decreasing it may not have much effect until ending lockdowns. Recommendations to improve the economy and the livelihoods of Americans: Safely reopen society by ending state and local government-mandated lockdowns. Get businesses operating and workers working again, such as with TPPF’s Recovery Act. Eliminate wasteful programs to rein in excessive government and end unnecessary regulations. https://www.texaspolicy.com/overview-of-executive-action-on-enhancing-unemployment-benefits/ Congress should scrap what’s currently being discussed in the next round of COVID-19-related recovery efforts. Instead, it should focus on getting businesses operating and workers working again after governments’ lockdowns severely disrupted the lives and livelihoods of Americans.
This can be done with the Foundation’s proposal of the Rehire America Workplace Recovery Act that includes the essential component of the free enterprise system: private property rights. The proposal focuses on giving people the dignity of work by compensating businesses for cash losses incurred due to governments’ shutting down of society due to COVID-19. These net operating losses by businesses were realized from government lockdowns (beyond prior voluntary social distancing measures). This proposal contrasts with much of the approach in Congress today that would prolong any economic weaknesses. Handing out stimulus checks (some of which are erroneously sent to dead people) doesn’t get people working again. Extending overly generous unemployment benefits that exceed what 68% of Americans were earning disincentivizes work. And saturating profitable businesses with taxpayer dollars while letting too many small businesses go under fails, too. The result of most of the current programs in Congress will be prolonged unemployment and weak growth. But our proposal would strengthen and shorten the recovery to let people prosper. The COVID-19 economy has been one of records set in both directions. The many disruptions during March and April plunged the country into a deep recession. The economy shed 22.2 million jobs, with the unemployment rate jumping from its historic low in February of 3.5% to 14.7% in April. Though official second quarter GDP figures have yet to be released, analysts are expecting a 30-plus percent annual rate of contraction. By any comparison, the U.S. economy has never experienced such a quick reversal in its economic condition. Though these numbers paint a bleak picture, there are more recent signs of optimism. The U.S. labor market in May and June added 2.7 and 4.8 million jobs, respectively. Both figures were record highs. More hiring drove the unemployment rate down to 11.1% in June. If this momentum continues, one would expect third quarter GDP to rebound from its projected second quarter low. Existing home sales rebounded in June, increasing by a record 20.7% providing additional evidence we’re likely in the beginnings of an economic recovery. The Recovery Act’s compensation strategy would assist this rebound. It provides funding to help employers keep current employees and to rehire those laid off due to cost-cutting associated with the COVID-19 shutdowns. It also conveys a core principle of effective programs in that it is self-terminating and temporary. A recipient’s participation in the program automatically ends once it’s no longer suffering cash losses or at the end of the program. That’s the goal of the Recovery Act — to stabilize business operations to provide confidence for firms to retain and rehire employees. In fact, it places a compensation premium of 20% on rehiring furloughed workers. By compensating businesses for cash losses (including employee costs), this proposal aligns with an improving economy. One of us estimated the economic and fiscal effects of this proposal depending on the duration from July to either September 2020 or February 2021 above the base case recovery over the next year. It would contribute to an extra $498 billion to $1.4 trillion in GDP, between 1.8 and 5.6 million new jobs, and cost taxpayers from $450 billion to $1.3 trillion. Though a hefty price tag for the longer duration, the $1.3 trillion cost looks to be within what Congress has authorized but not disbursed yet from prior phases of economic aid so no new spending may be necessary if reallocated. If that’s not an option, the Act’s benefits outweigh the cost and would repay itself under six years. These results seem much better than the major packages considered by Congress. The spirit of the Recovery Act is in a recent bipartisan bill called the Small Business Recovery Comeback Act so there’s a way to get this done for Americans. It could be improved by including more of the aspects that we’ve outlined above to make it cost-effective and time-constrained. We need Congress to take a fresh start rather than funding the same flawed programs and principles. The Recovery Act is grounded in a free enterprise system. This is both an economic argument and a moral imperative to recover Americans’ livelihoods. https://www.texaspolicy.com/how-to-recover-americans-livelihoods/ The media loves to portray Americans as stubborn—refusing to abide by the measures that could help address the COVID-19 pandemic. Yet the data show that Americans were already doing their part, long before measures became mandates.
The Institute for Health Metrics and Evaluation has a measure of social mobility. Based on anonymous cell phone data made available by phone companies to help fight the pandemic, the measure shows how much people get out, get around and even mingle. This measure shows that the U.S. was running at about a 2% rate of mobility compared with a typical 0% before March 2020. That’s our pre-pandemic base rate. By March 10, that positive mobility rate had turned to a negative 1% and fell further to negative 13% by March 15. Then many state and local governments started locking down society, which the mobility rate fell to a low of negative 51% by March 31—end of the first quarter. In other words, people were already voluntarily practicing social distancing before governments made it mandatory. But the mandates meant that many businesses had to close, so no matter what people were voluntarily doing, much of Americans’ action and interaction stopped. Though the economy was surging in January and February—reaching historic bests in the labor market, things fell off of a cliff in March as the economy cratered at an annual rate of 5%. For comparison, the economy hasn’t contracted that much since the depths of the Great Recession when it fell by 8.4%. This time that 5% was just the beginning as the second quarter will be much worse. More than 22 million Americans lost their job through April. Fortunately, though, job creation has turned around some as there have been 7.8 million jobs added back. But there’s a long way to go. This recovery is going to be unique because some states that didn’t make as extensive lockdowns or started reopening faster will have more economic rebound. This was apparent in the latest state-level jobs report which showed that Texas led the way in getting folks back to work, and other states that have been reopening faster also had more jobs added. While Texas has been in the news lately from increasing infections (even though hospitals aren’t overwhelmed and the death rate remains relatively low), the full context of the situation in the Lone Star state must also include the effect on livelihoods. Tracking social mobility in Texas, IHME shows that the state had a higher level of mobility than the U.S. going into March. This turned negative on March 11 from voluntary social distancing, and then was at negative 49% by March 31 after the shutdown. This contributed to the economy contracting by just 2.5% in Texas, or just half the rate of the nation as a whole. South Dakota, on other hand, is a rural state that did not lockdown its citizens. Their social mobility turned negative on March 12 and was at negative 36% by the end of the quarter. The lack of a mandate by government helped the state to contract by only 2.2% in the quarter. California’s social mobility was running slower than Texas or South Dakota going into March, turned negative on March 7 from voluntary social distancing, and negative 52% by the end of March after mandates. California’s mobility fell faster and remained lower from a more extreme lockdown. This decline in mobility contributed to California’s drop of 4.7% in economic output—almost double the rate of Texas in the first quarter. The key here is to understand people act rationally. The rates of social mobility show people were practicing social distancing before mandates were imposed. Wearing a mask, practicing social distancing, and taking care of the elderly and vulnerable will be the norm for the vast majority of people without the destructive effects of government mandates and lockdowns. https://www.texaspolicy.com/dont-let-fear-drive-covid-19-policy/ In a recent poll, parents’ top concern was whether their children will miss in-person school instruction time. And they have good reason to be concerned as 67% of teachers said completion rates of student assignments were worse than in-person instruction.
This hurts disadvantaged students the most, as the Texas Education Agency recently noted that students in low-income families across the U.S. had a drop of 55.6% in online math coursework whereas those in middle-income families had a 34.2% decline and in high-income families actually had a 4.8% increase. These losses in students’ participation in learning can contribute to lower lifetime earnings, with a troubling racial achievement disparity. One study finds that the educational level of the average black or Hispanic student is already two years behind the average white student. These differences are based on multiple factors, including place of residence and wealth disparity. Delaying in-person instruction due to fears about COVID-19 will exacerbate this disparity. That study notes that if in-person instruction doesn’t start until January 2021 across the U.S., then while “white students would earn $1,348 a year less (1.6% reduction) over a 40-year working life, the figure is $2,186 a year (3.3% reduction) for black students and $1,809 (3.0% reduction) for Hispanic ones.” Add to that how disadvantaged students tend to lose educational progress during school breaks as there’s usually less parental involvement and resources available to them than other students. Just think of how months of missed in-person instruction would set them back. Even if government schools were to educate every student at the same level, the disparity between races and socioeconomic statuses will grow without the choice of in-person instruction. Unfortunately, minorities and poor Texans will suffer the most from this policy choice but would benefit most from that choice. Despite these concerns, Austin ISD and many other school districts across the state have already decided to have only virtual education for the first few weeks of the school year. But what of educators’ fears? Pediatricians, educators, and superintendents from organizations across America recently released a letter noting, “Returning to school is important for the healthy development and well-being of children, but we must pursue re-opening in a way that is safe for all students, teachers and staff. Science should drive decision-making on safely reopening schools.” The Austin Public Health Interim Health Authority Dr. Mark Escott recently told Travis County Commissioners that having in-person instruction would put the lives of the 192,000 students in Travis County in jeopardy. While he accurately noted that there have been no reported COVID-19 deaths of those under 19 years old in Austin/Travis County, he said there could be “between 40 and 1,370 deaths in that age group.” But given flaws in the modeling, these projections are highly suspect. First, Dr. Escott couldn’t use local data because there were no deaths among school-age children, so he resorted to using China’s data—where there was one death out of 965 cases of those 19 years old or younger. But extrapolating those data from a communist country like China is a poor choice given the different demographics and health of people. This was also the case with Neil Ferguson who projected the U.S. would have 2.2 million deaths from COVID-19 without any other changes—deaths are currently less than 150,000. Second, even with the problems with America’s government-dominated health care system, its quality and results are much better than the system in China. And the treatments here are better. Third, COVID-19 seems to be ineffective in harming and spreading among young people or teachers globally. Considering the poor modeling of the effects of COVID-19 such as Dr. Escott’s high estimate of 1,370 deaths that’s more than the 1,032 deaths of those 34 years old and younger across the U.S. as of July 15, we should be highly skeptical of these types of projections. So, why delay or deter the choice of in-person instruction when the lives and livelihoods of kids, parents, teachers are at stake? It would be a disservice to the Texans who need opportunity the most. https://www.texaspolicy.com/students-futures-at-risk-without-choice-of-in-person-schooling/ Many states are demanding more money from the federal government to deal with the COVID-19 situation.
But providing even more bailout money to states would mean inappropriately supporting years of poor fiscal management and incentivizing unnecessary government lockdowns. Ultimately, bailing out states means less money in our pockets at a time when many of us are struggling financially — and fewer opportunities for entrepreneurs to help conquer the effects of the novel coronavirus. Democrats in the U.S. House of Representatives recently passed the HEROES Act to spend more than $3 trillion in response to the COVID-based recession, with $1 trillion of that going to bailout states. And now the Republicans and the White House seem to be coalescing around a bill of about $1 trillion without state bailouts. While we are discussing such large numbers, recall that the U.S. is $26 trillion in debt (roughly $80,000 owed by every American) or 130 percent of economic output, which is the highest since at least the Great Depression. Also, the federal government is likely to run at least a record of a $4 trillion deficit this fiscal year (about $10,000 per person). In short, the government has no money to spend, and the House Democrats want to spend $3 trillion more that the federal government doesn’t have. And $1 trillion would be handed out to state and local governments, rewarding those who mismanaged their finances and the COVID situation. Not only is this act a bailout — which is bad enough — but it far exceeds what’s needed. According to the Tax Foundation, state governments are expected to have a tax receipts shortfall over this year and the next of at least $121 billion compared with a 2019 baseline due to the COVID-related recession. In March, the CARES Act dedicated $150 billion to cover this potential shortfall. Total resources dedicated to state and local governments has been $1 trillion so far. Fortunately, there are practical, responsible steps that states can take to weather this storm and to overcome potential shortfalls. First, states must end lockdowns that force employers to close their business and workers to lose their jobs. Reopening society would revitalize the human ingenuity of entrepreneurs to not only better deal with the COVID situation through trial and error rather than one-size-fits-all policies but to also rehire workers. This would have the secondary effect of increasing tax receipts. Second, states must restrain their spending, which is always and everywhere the primary source of budget shortfalls. This can be done by eliminating wasteful expenditures and freezing inflation-adjusted per capita spending to keep it within the means of taxpayers. Doing so will help the government from growing excessively and putting a higher tax burden on taxpayers, especially when they’re already struggling. The other things that would provide a pro-growth environment to help Americans deal with this unfortunate health situation is for states to not raise taxes or regulations, and in fact, they should consider cutting them. We can make it through this crisis without sacrificing the future. State and local leaders must make the hard choices for the good of their communities, and we must support and encourage them to be good stewards with our money. And Congress should scrap their current strategy, which hasn’t worked well, and instead consider the Workplace Recovery Act to keep struggling businesses operating so employers and workers don’t lose their livelihoods while limiting excessive government spending. By safely ending the lockdowns and responsibly budgeting our tax dollars, governments at all levels can help restore opportunities for us to pursue our hopes and dreams. Bailouts would only achieve the opposite. https://www.texaspolicy.com/heroes-should-congress-bail-out-states/ (The Center Square) – Stimulus checks for Americans at the onset of the COVID-19 pandemic made sense, but a potential second round could prevent some recipients from working and prolong fiscal recovery, an economist says.
“Ultimately what we’re for is people going back to work,” Vance Ginn, chief economist at the Texas Public Policy Foundation (TPPF), told The Center Square. “We need to find a responsible way to end the shutdowns, and find ways for people to get back to work, instead of having incentives to not go back.” Another stimulus check for individuals and families has been discussed as part of the next phase of federal coronavirus relief. “There may have been good reason for stimulus checks during the major part of the pandemic outbreak, but we think that time is over now,” Ginn said. “The stimulus check payment was put in place when many people were forced out of work, but now we’re looking at how to get people back to work and having businesses open.” There are other ways to help people pay their bills and expenses, said Ginn, who formerly served as associate director for Economic Policy in the Office of Management and Budget at the White House. The $600 weekly unemployment benefit that Congress included in the CARES (Coronavirus Aid, Relief, and Economic Security) Act expires at the end of July, but people can still get state unemployment, which usually pays about 50 percent of what their weekly income was, Ginn said. As short-term federal programs from the pandemic’s onset wind down, other proposals are under consideration to help businesses. One is the Workplace Recovery Act, which addresses operational losses incurred during the government shutdowns. “It would focus on replenishing net operating losses for businesses so they can stay in business,” Ginn said. A payroll tax cut for employers and employees through the end of the year also would put more money in the pockets of workers, and incentivize businesses to grow because they would have lower costs and do more hiring, Ginn said. Another key component to economic recovery is quelling fear. “We need to deal with the pandemic situation in its full context,” Ginn said, “We don’t need to resort to lockdowns and closing society again because it would have a devastating effect on our lives and livelihoods.” https://www.thecentersquare.com/national/economist-going-back-to-work-will-lead-economy-forward-not-another-stimulus-check/article_de962a2a-bf8a-11ea-8319-ab8b6537a308.html |
Vance Ginn, Ph.D.
|

 RSS Feed
Proudly powered by Weebly