|
In this let people prosper episode, I discuss two key reports released today. The first is that the Energy Information Administration reported that the U.S. oil production exceeded Russia and Saudi Arabia to become the top oil producer in the world in August 2018. The second is the Census Bureau released the latest income and poverty-related data that shows less poverty nationwide with little change in Texas' supplemental poverty measure (SPM) while California still has the highest SPM in the nation. Regarding the EIA's data, the following figure shows this historic moment in U.S. history. Here's the EIA's projection through 2019: "Although EIA does not publish crude oil production forecasts for Russia and Saudi Arabia in STEO, EIA expects that U.S. crude oil production will continue to exceed Russian and Saudi Arabian crude oil production for the remaining months of 2018 and through 2019." Much of this expansion in oil production has been in Texas. In fact, Texas is producing a record amount of oil at 4.4 million barrels per day as of June 2018 (latest data available), which is about 40% of total U.S. production that month. 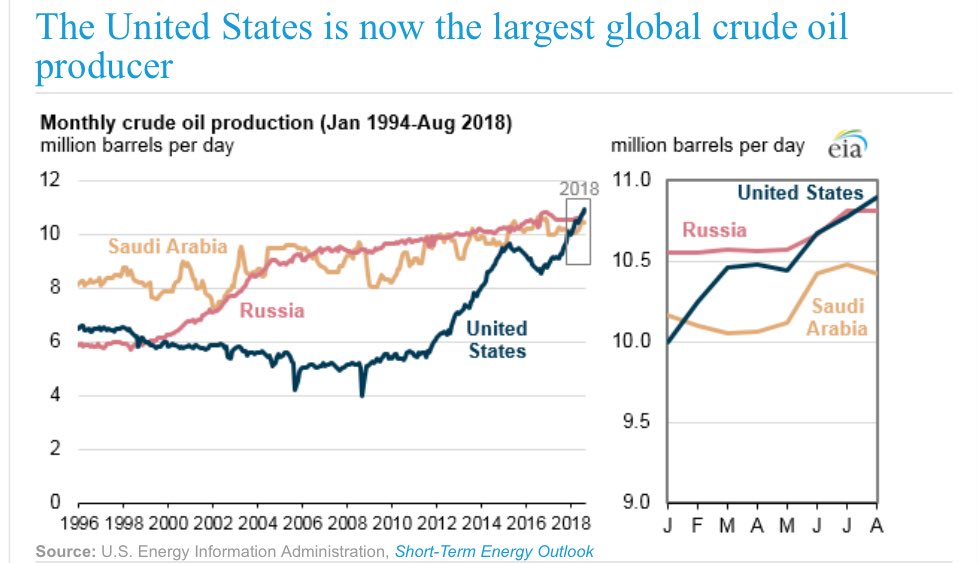 The increase in oil production in the last couple of years has contributed to faster economic growth and job creation, thereby helping to reduce the poverty rate. Of course, this is a relatively small direct relationship, but the indirect relationship of more production capacity in the private sector is quite remarkable. Moreover, the regulatory cuts last year and the general increased economic activity and job creation in recent years has helped get people out of poverty. This is noted by poverty measures improving some in the latest report for the average of the 2015-17 period (see page 26-27 of this report). The Official Poverty Measure (OPM) looks at one poverty level across the entire nation with the federal poverty level of $12,752 for an individual and a family of four (two adults and two kids) of $24,858. The OPM declined to 12.9%, or 41.2 million, nationally for the average of 2015-17. However, the OPM is a poor measure of poverty because there are different housing costs in each state along with different levels of government benefits. Several years ago the Census Bureau created the Supplemental Poverty Measure (SPM) that accounts for after-tax income, differences in regional costs of housing and other expenditures, and government transfers (see figure below). The SPM declined to 14.1 percent, or 45.3 million, nationally. 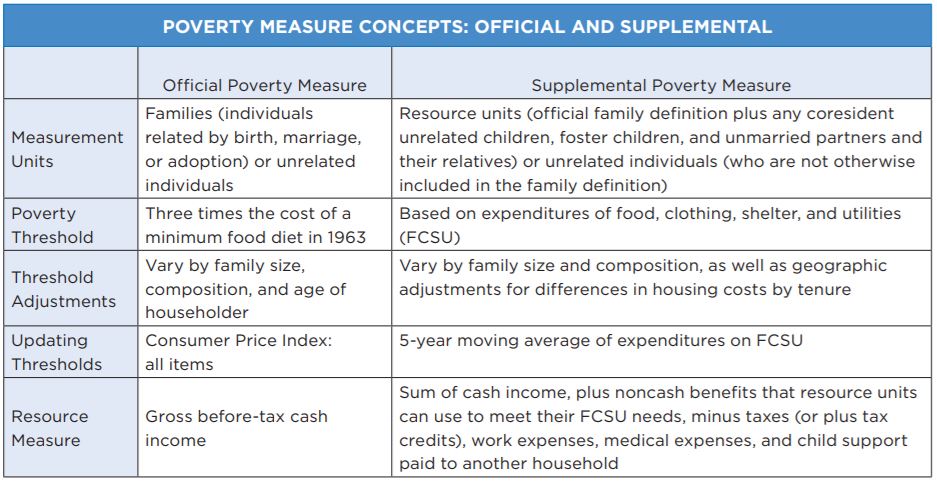 These measures for the 2015-17 period are also available by state. Let's consider the two largest states: California and Texas. California's OPM is 13.4%, which is near the national average, with 5.3 million people in poverty, and SPM is 19%, which is the highest nationally, with 7.5 million in poverty. Texas' OPM is 14%, more than a percentage point higher than the national average, with 3.9 million people in poverty, and SPM is 14.7%, which is near the U.S. average, with 4.1 million in poverty. These data make sense because Texas is a relatively cheaper place to live that in California so Texans' dollars go a lot further than Californians' even as California has a more liberal welfare state and spends much more per capita. 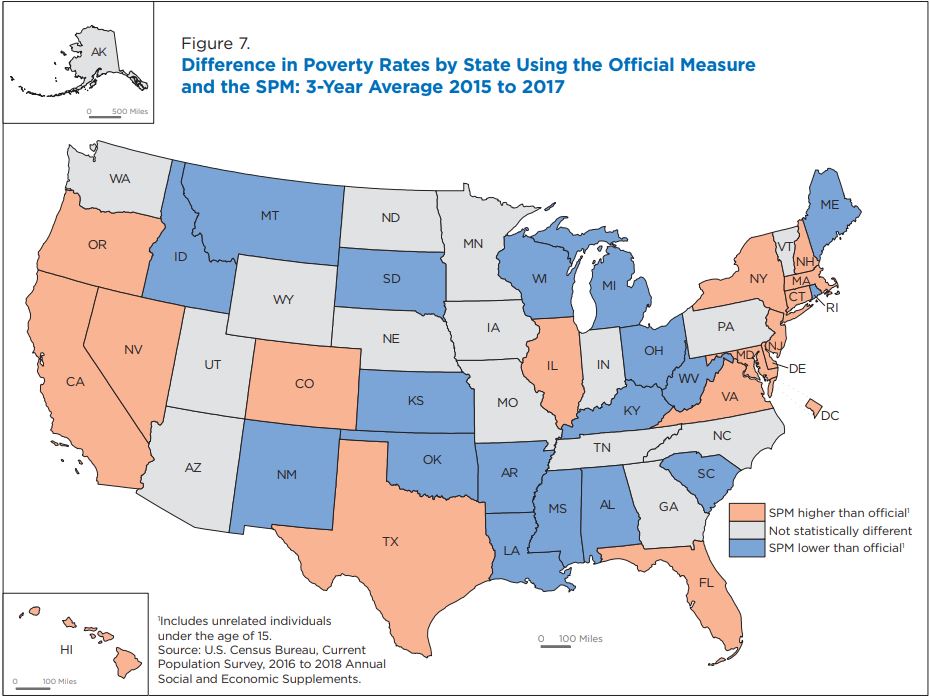
1 Comment
Melody Lane
9/13/2018 09:33:27 am
This is amazing. Thanks for sharing. Go Texas!!! Leave a Reply. |
Vance Ginn, Ph.D.
|

 RSS Feed
Proudly powered by Weebly