|
Key Point: Average weekly earnings adjusted for inflation are now down for 23 straight months year-over-year as inflation keeps roaring. But there’s hope if we give free-market capitalism a chance to let people prosper. 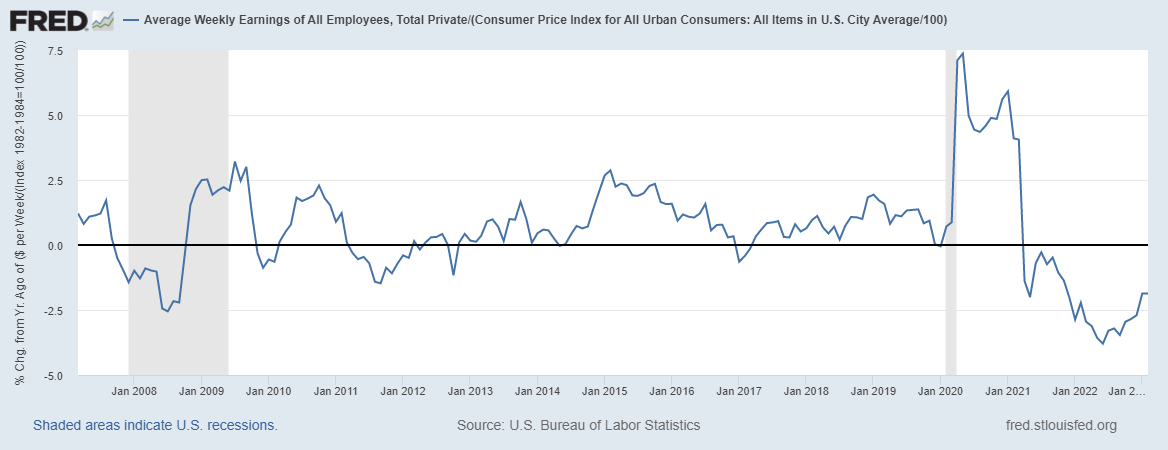 Overview: The government failures that drove the “shutdown recession,” high inflation, and weak economic growth over the last three years continue to plague Americans. This includes excessive federal spending leading to massive cumulative deficit spending of $7.6 trillion since January 2020 to reach $31.6 trillion in national debt—about $250,000 owed per taxpayer. This has created a fight between the Biden administration and House Republicans over the debt ceiling, as raising it must come with spending restraint. And more inflation is on the horizon as the Federal Reserve recently increased its balance sheet and the government creates rampant moral hazard by insuring what appears to be all deposits at big banks. The solution to these problems are pro-growth policies of shrinking government back to its constitutional roles. Labor Market: The Bureau of Labor Statistic recently released its U.S. jobs report for February 2023. After substantial revisions in the previous report which likely indicate bias in these data for a while, there were some signs of strength while others suggest weakness. The establishment survey shows there were +311,000 (+2.9%) net nonfarm jobs added in February to 155.4 million employees, with +265,000 (+3.0%) added in the private sector and +46,000 (+1.9%) jobs added in the government sector. Most of the private sector jobs were added in the sectors of leisure and hospitality (+105,000), private education and health services (+74,000), and retail trade (+50,100), which the first two sectors also led over the last 12 months; information (-25,000), manufacturing (-4,000), utilities (-1,100), and financial activities (-1,000) had net job declines last month and only retail trade (-2,300) declined over the last year. The household survey had another increase of +177,000 jobs to 160.3 million employed. There have been declines in net jobs in four of the last 11 months for a total increase of +2 million since March 2022, which is about half of the +3.9 million net jobs per the establishment survey. The official U3 unemployment rate rose to 3.6% and the broader U6 underutilization rate rose to 6.8%. Since February 2020 before the shutdown recession, the prime age (25-54 years old) employment-population ratio is flat at 80.5%, prime-age labor force participation rate was 0.1-percentage point higher at 83.1%, and the total labor-force participation rate was 0.8-percentage-point lower at 62.5%with millions of people out of the labor force thereby holding the U3 unemployment rate artificially low But challenges remain for Americans as inflation-adjusted average weekly earnings were down -1.9% over the last year for the 23rd straight month. Economic Growth: The U.S. Bureau of Economic Analysis’ recently released the 2nd estimate for economic output for Q4:2022. The following table provides data over time for real total gross domestic product (GDP), measured in chained 2012 dollars, and real private GDP, which excludes government consumption expenditures and gross investment. And most of the estimates for Q4:2022 and growth in 2022 were revised lower, providing more evidence that 2022 was a very weak year if not a recession. 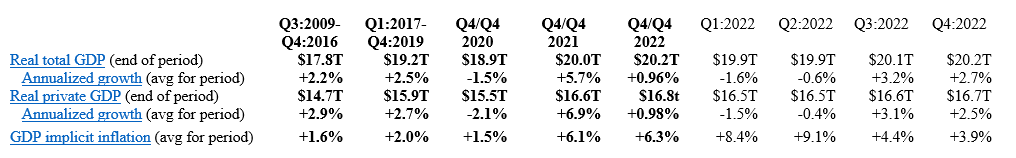 Economic activity has had booms and busts thereafter because of inappropriately imposed government COVID-related restrictions in response to the pandemic and poor fiscal policies that severely hurt people’s ability to exchange and work. Since 2021, the growth in nominal total GDP, measured in current dollars, was dominated by inflation, which distorts economic activity. The GDP implicit price deflator was +6.1% for Q4-over-Q4 2021, representing half of the +12.2% increase in nominal total GDP. This inflation measure was +9.1% in Q2:2022—the highest since Q1:1981—for a +8.5% increase in nominal total GDP that quarter. This made two consecutive declines in real total (and private) GDP, providing a criterion to date recessions every time since at least 1950. In Q3:2022, nominal total GDP was +7.6% and GDP inflation was +4.4% for the +3.2% increase in real total GDP. But if inflation had been as high as it was in the prior two quarters or had the contribution of net exports of goods and services (driven by natural gas exports to Europe) not been 2.9%, real total GDP would have either declined or been essentially flat for a third straight quarter. In Q4:2022, there was a similar story of weakness as nominal total GDP was +6.6% and GDP inflation was +3.9% for the +2.7% increase in real total GDP. But if you consider the +2.7% real total GDP growth was driven by contributions of volatile inventories (+1.5pp), government spending (+0.6pp), and next exports (+0.5pp) which total +2.6pp, the actual growth is quite tepid like it was in Q3:2022. For all of 2022, real total GDP growth is reported +2.1% year-over-year but measured by Q4-over-Q4 the growth rate was only +0.9%, which was the slowest Q4-over-Q4 growth for a year since 2009 (last part of Great Recession). The Atlanta Fed’s early GDPNow projection on March 24, 2023 for real total GDP growth in Q1:2023 was +3.2% based on the latest data available. The table above also shows the last expansion from June 2009 to February 2020. A reason for slower real private GDP growth in the latter period is due to higher deficit-spending, contributing to crowding-out of the productive private sector. Congress’ excessive spending thereafter led to a massive increase in the national debt by nearly +$7 trillion that would have led to higher market interest rates. This is yet another example of how there is always an excessive government spending problem as noted in the following figure with federal spending and tax receipts as a share of GDP no matter if there are higher or lower tax rates. 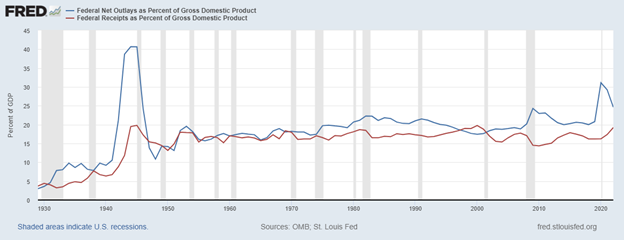 But the Fed monetized much of the new debt to keep rates artificially lower thereby creating higher inflation as there has been too much money chasing too few goods and services as production has been overregulated and overtaxed and workers have been given too many handouts. The Fed’s balance sheet exploded from about $4 trillion, when it was already bloated after the Great Recession, to nearly $9 trillion and is down only about 2.6% since the record high in April 2022 after rising nearly $400 billion in March 2023. The Fed will need to cut its balance sheet (total assets over time) more aggressively if it is to stop manipulating so many markets (see figure below with types of assets on its balance sheet) and persistently tame inflation, which there’s likely a need for deflation for a while given the rampant inflation over the last two years. 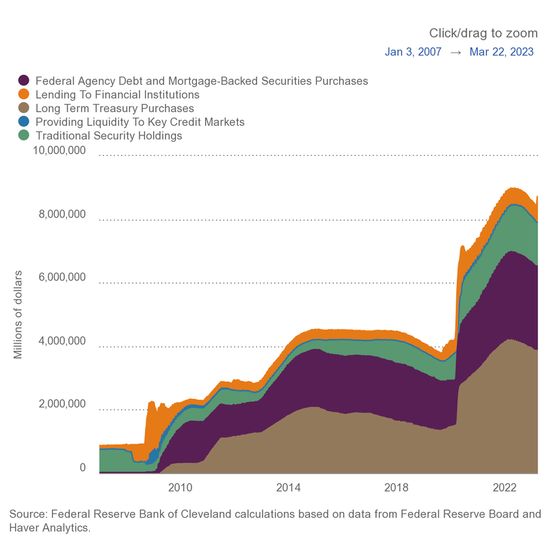 The resulting inflation measured by the consumer price index (CPI) has cooled some from the peak of +9.1% in June 2022 but remains hot at +6.0% in February 2023 over the last year, which remains near 40-year highs along with other key measures of inflation. After adjusting total earnings in the private sector for CPI inflation, real total earnings are up by only +2.2% since February 2020 as the shutdown recession took a huge hit on total earnings and then higher inflation hindered increased purchasing power. Just as inflation is always and everywhere a monetary phenomenon, deficits and taxes are always and everywhere a spending problem. The figure by David Boaz at Cato Institute shows how this problem is from both Republicans and Democrats. As the federal debt far exceeds U.S. GDP, America needs a fiscal rule like the Responsible American Budget (RAB) with a maximum spending limit based on population growth plus inflation. If Congress had followed this approach from 2003 to 2022, the figure below shows tax receipts, spending, and spending adjusted for only population growth plus chained-CPI inflation. Instead of an (updated) $19.0 trillion national debt increase, there could have been only a $500 billion debt increase for a $18.5 trillion swing in a positive direction that would have substantially reduced the cost of this debt to Americans. The Republican Study Committee recently noted the strength of this type of fiscal rule in its FY 2023 “Blueprint to Save America.” And to top this off, the Federal Reserve should follow a monetary rule so that the costly discretion stops creating booms and busts. 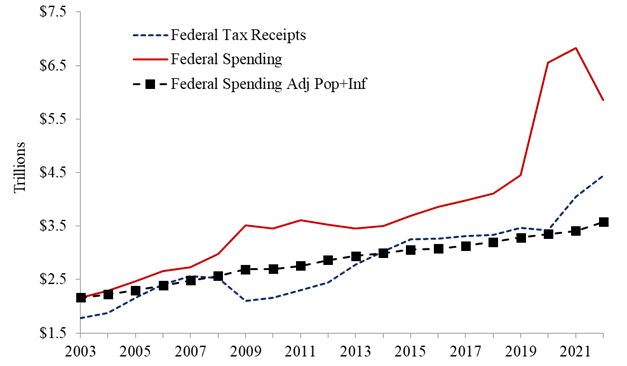 Bottom Line: My expectation is that stagflation will continue along with the a deeper recession this year given the “zombie economy” and the unraveling of the banking sector which will hit main street. Instead of passing massive spending bills, the path forward should include pro-growth policies that get government out of the way rather than the progressive policies of more spending, regulating, and taxing. The time is now for limited government with sound fiscal and monetary policy that provides more opportunities for people to work and have more paths out of poverty.
Recommendations:
0 Comments
Leave a Reply. |
Vance Ginn, Ph.D.
|

 RSS Feed
Proudly powered by Weebly