 Originally published at Pelican Institute. It’s Geaux Time in Louisiana. The potential changes in Baton Rouge to remove barriers to work and let people keep more of their hard-earned money provide a more optimistic path for the Pelican State. This is much needed given the declining population over time and declines in employment for eight straight months. Let’s consider the latest data to see what’s really going on. The U.S. Bureau of Labor Statistics recently released Louisiana’s labor market data for February. These data provide details to evaluate how people are doing across the state. Louisiana’s unemployment rate increased to 4.2% per the household survey.
Employment has declined by 16,034 since March 2023, with employment declining in eight of the last eleven months.
Louisiana workers’ purchasing power continues to decline across most industries.
Figure 1. Louisiana’s Labor Market by Industry 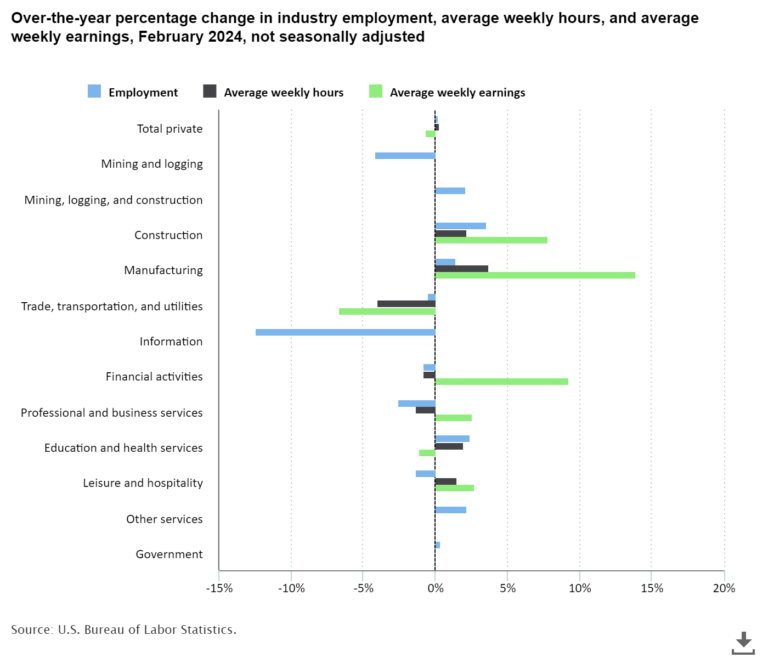 Economic growth has slowed, and GDP and personal income growth are below the U.S. average.
 Bottom Line: Louisiana’s economy is mostly weak with some green shoots for growth. These past results are based on the state’s complicated tax system, high regulations, and excessive government spending that have resulted in a poor business tax climate, net out-migration, and one of the highest poverty rates in the country. But with changes in Baton Rouge this year, there is an opportunity for bold, pro-growth reforms.
These bold reforms include:
0 Comments
 Originally published at Texans for Fiscal Responsibility. Overview
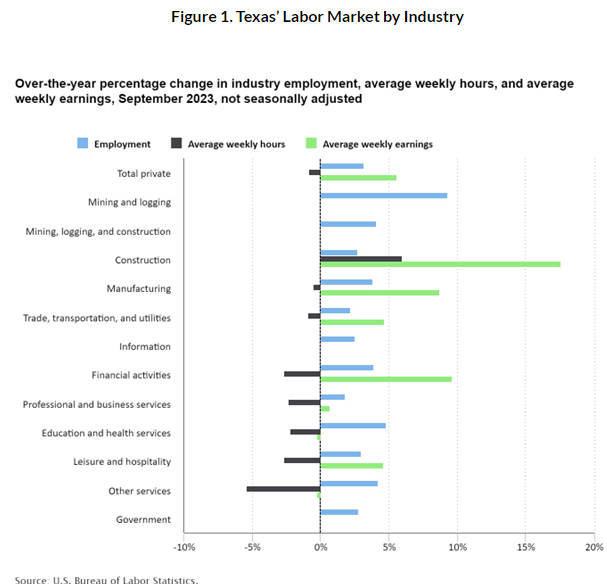
Texas’ employment has been up for 44 of the last 46 months since May 2020.
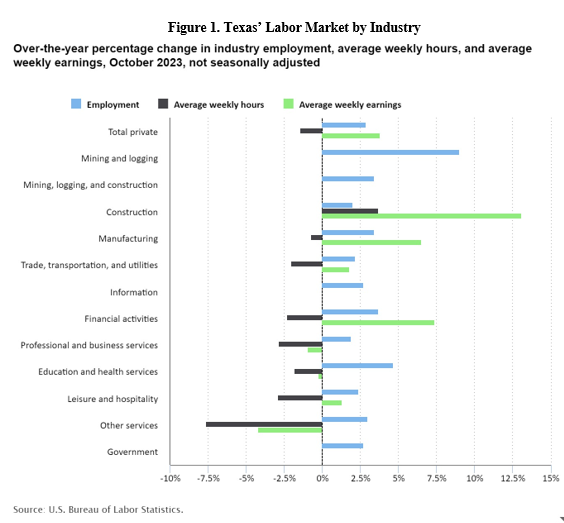
Figure 1. Texas Labor Market by Industry 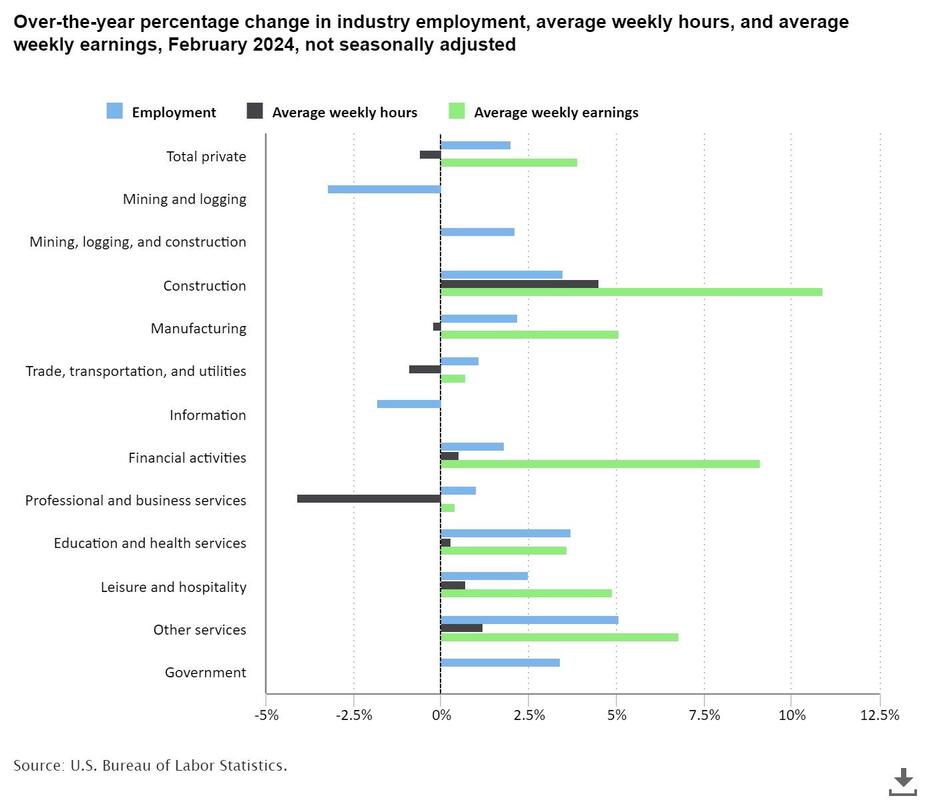 Source: U.S. Bureau of Labor Statistics Economic growth has picked up, but personal income lags the U.S. average.
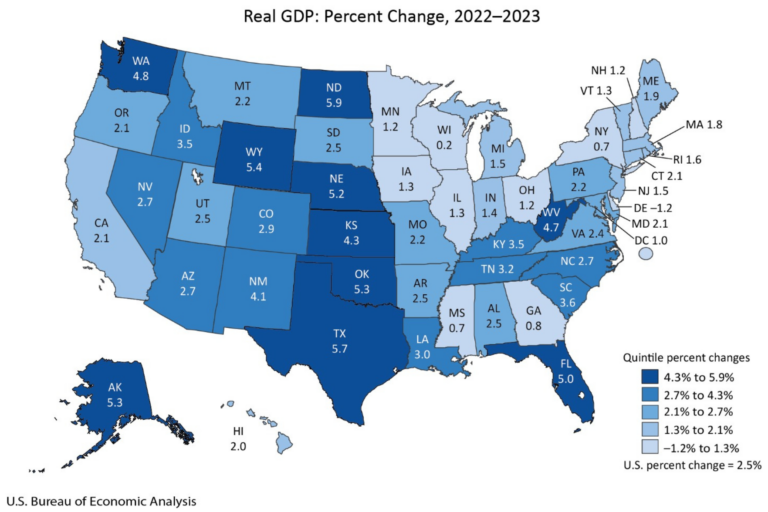
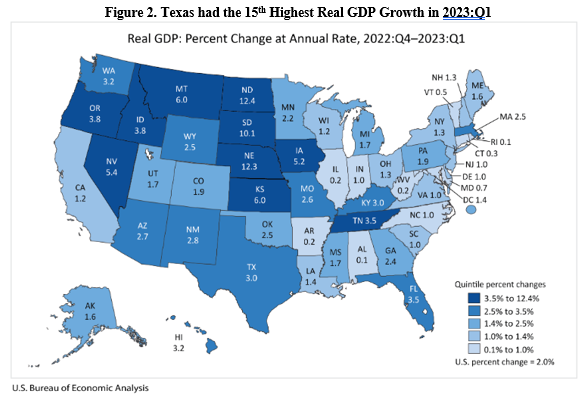
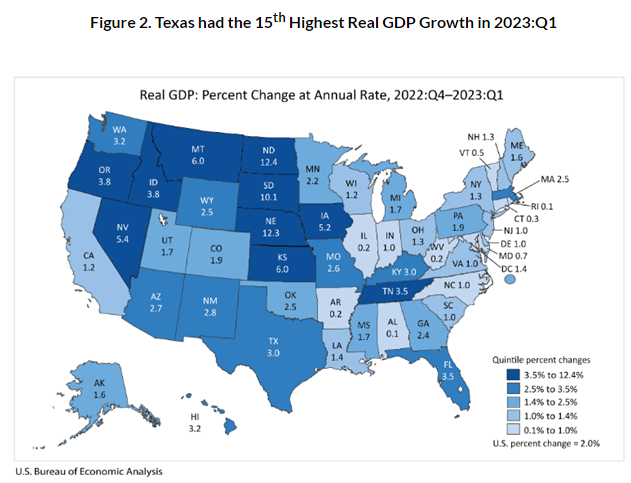
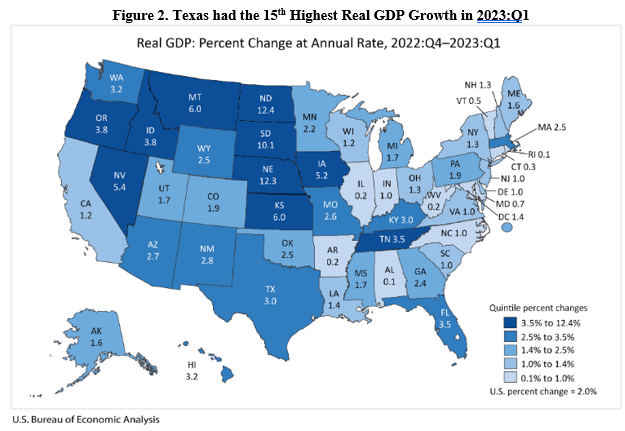
Figure 2: Real Gross Domestic Product by State in 2023 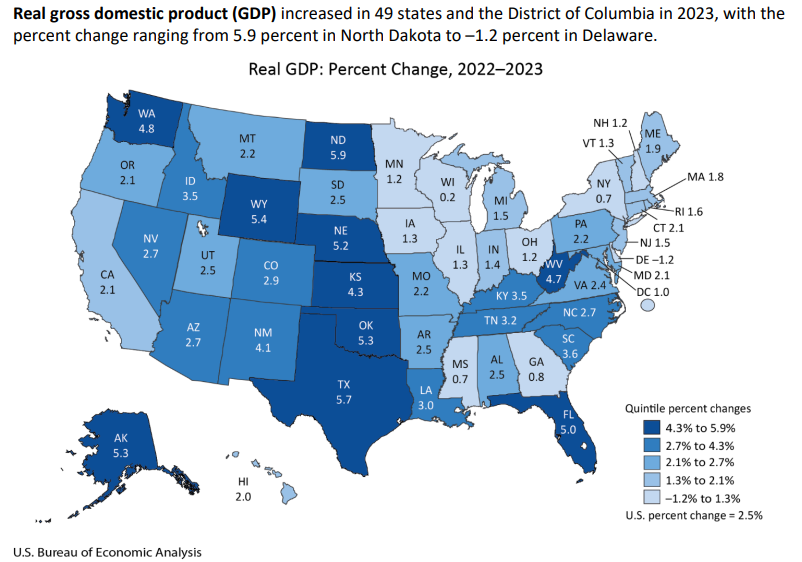 Improve the Texas Model with pro-growth policies that limit government by:
 Originally published at Texans for Fiscal Responsibility. Highlights
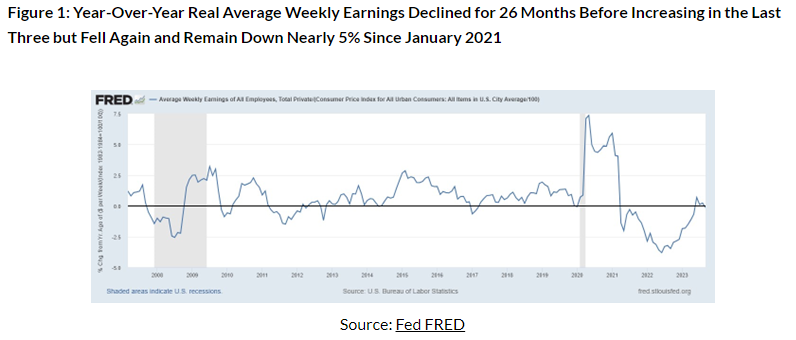
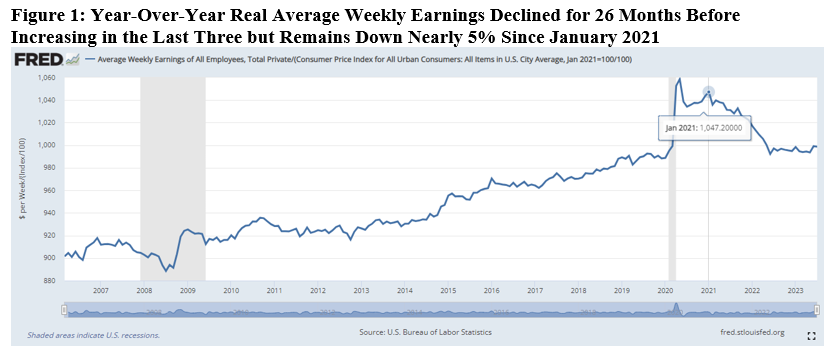
Figure 1: Real Average Weekly Earnings Remain Down 4.2% Since January 2021 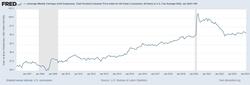 Source: Fed FRED Labor Market The Bureau of Labor Statistics recently released its U.S. jobs report for February 2024, which was another mixed report with some strengths but many weaknesses.
Figure 2. Changes in Employment by Industry Over the Last Year 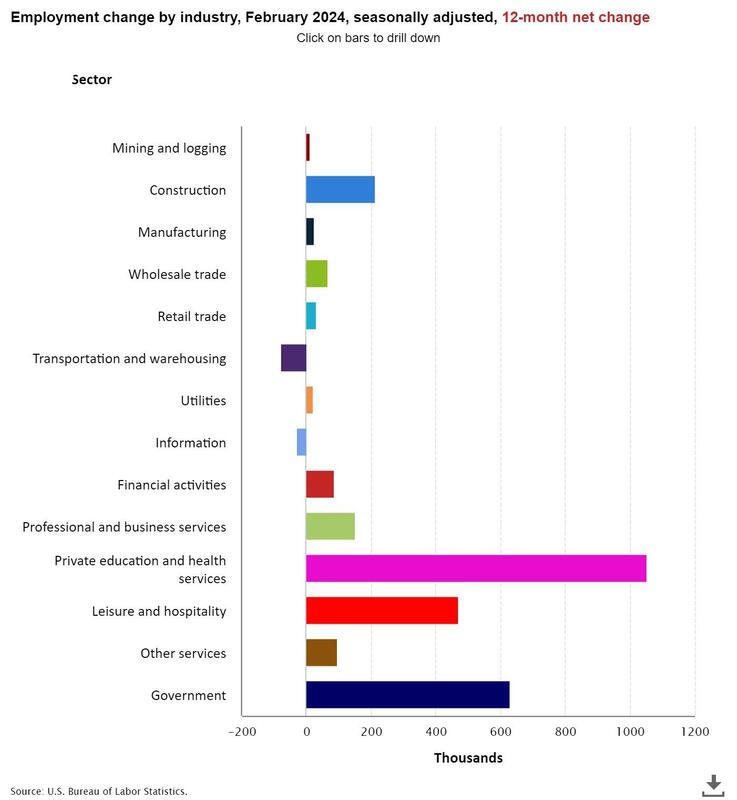 Source: Fed FRED
Figure 3. Establishment Nonfarm Jobs Far Outpace Household Employment Level Since March 2022 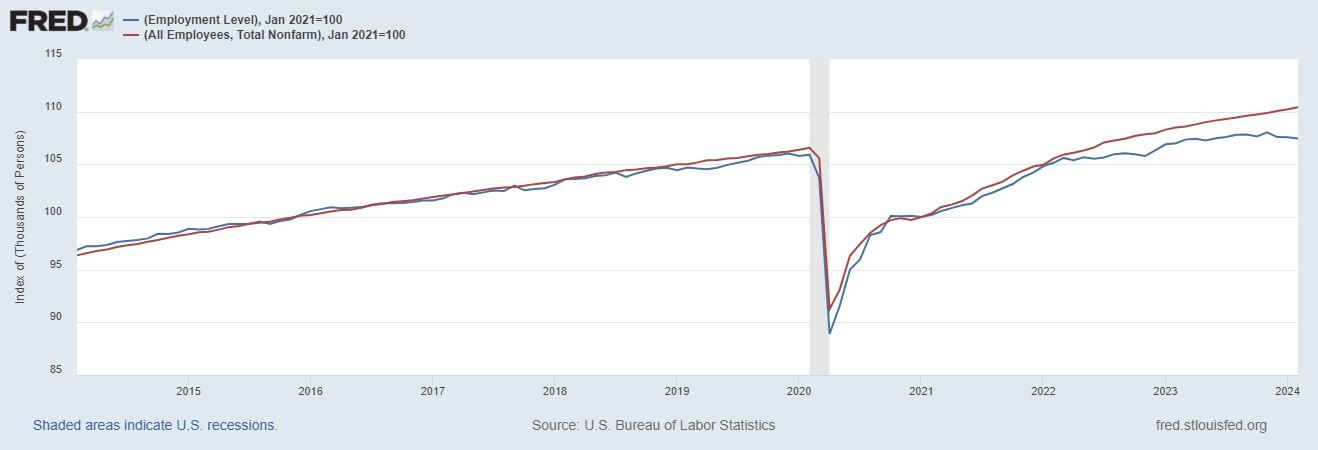 Source: Fed FRED
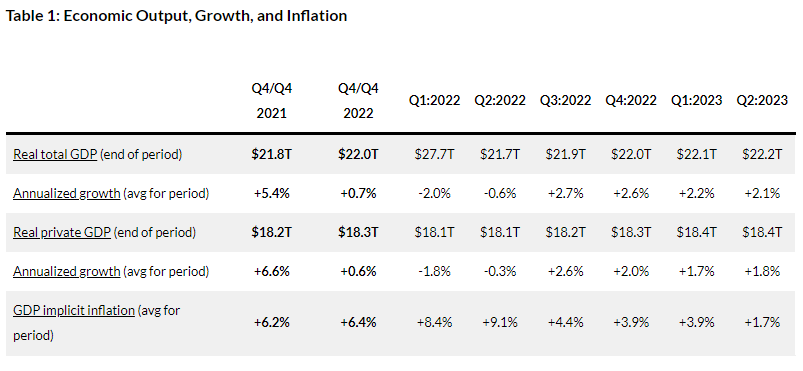
Economic Growth The U.S. Bureau of Economic Analysis recently released the third estimate for economic output in the fourth quarter of 2023.
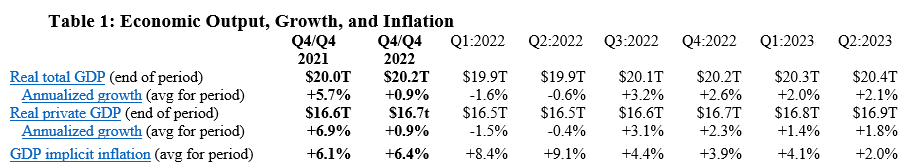
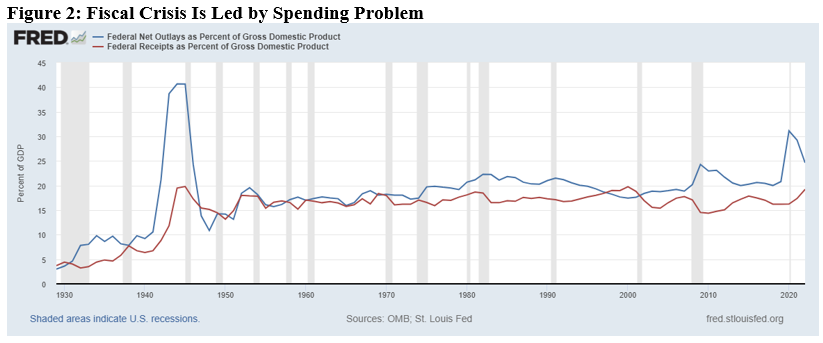
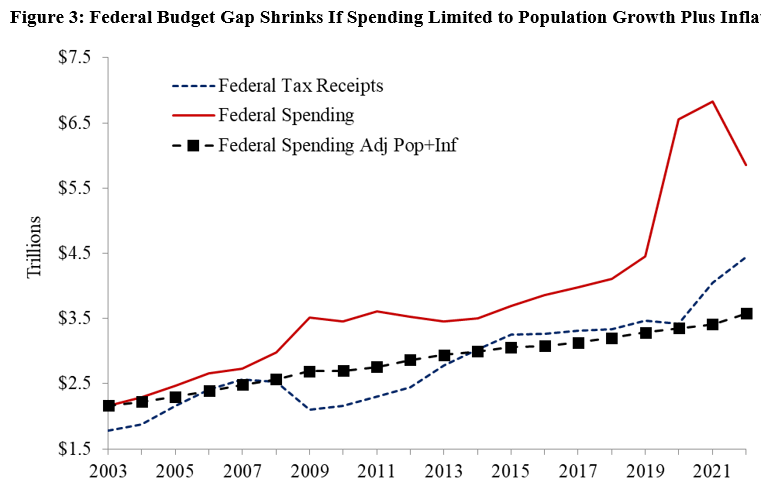
Table 1: Economic Output, Growth, and Inflation 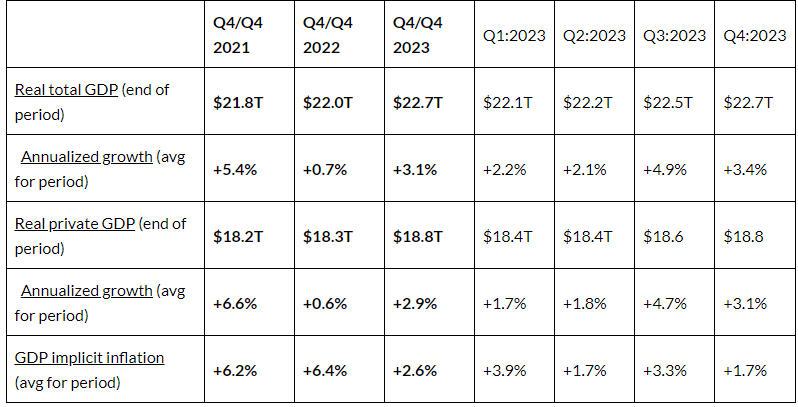 Another key measure of economic activity is the real average of GDP and GDI, which accounts for domestic production and income and is known as real gross domestic output. Real GDO in the third quarter increased by 3.4%, and in the fourth quarter increased by 4.1% to $22.5 trillion. Figure 4 shows how this measure has declined on an annualized basis in three of the last eight quarters, increasing this value by only 2.9% since the fourth quarter of 2021 before the two consecutive quarters of declines in the first and second quarters of 2022. Figure 4. Annualized Real Gross Domestic Output Growth 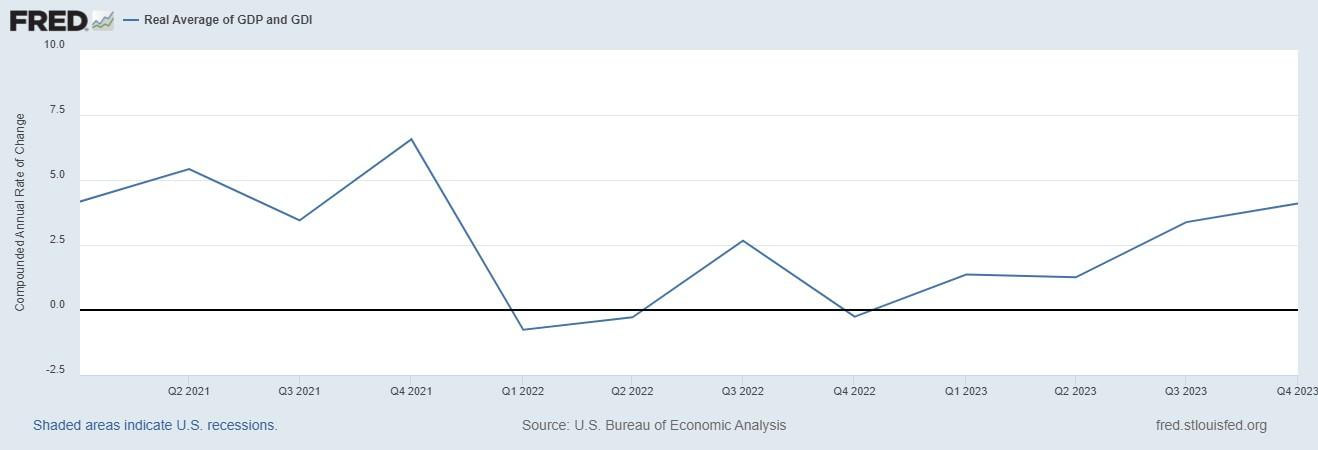 Meanwhile, the federal budget deficit continues unabated because of overspending and declining tax collections from a weaker economy. The national debt has ballooned to $34.6 trillion, and net interest payments on the debt will soon be a top federal expenditure, rising to above $1 trillion. The Federal Reserve has monetized, or printed, much of the new Treasury debt to keep interest rates artificially lower than where the market would suggest. The Fed will need to cut its balance sheet (total assets over time) more aggressively if it is to stop manipulating markets (see this for types of assets on its balance sheet) and persistently tame inflation. The current annual inflation rate of the consumer price index (CPI) has been moderating since a peak of 9.1% in June 2022 but remains elevated at 3.2% in February 2024. Compared with the Fed’s average inflation rate target of 2%, which really should be 0%, the current CPI inflation rate is too high, as are other key measures of inflation. A recent paper by Larry Summers, who was the 71st Secretary of the Treasury for President Clinton and Director of the National Economic Council for President Obama, and co-authors notes that if the calculation of CPI kept housing calculation methods and personal interest payments in, then the latest peak in inflation would have been 18% instead of 8.1%. Figure 5 shows their chart with these data that also highlights how the method-adjusted inflation would be closer to 10% instead of the reported 3.1%. Figure 5. CPI Inflation Differences When Methods Are Similar Over Time 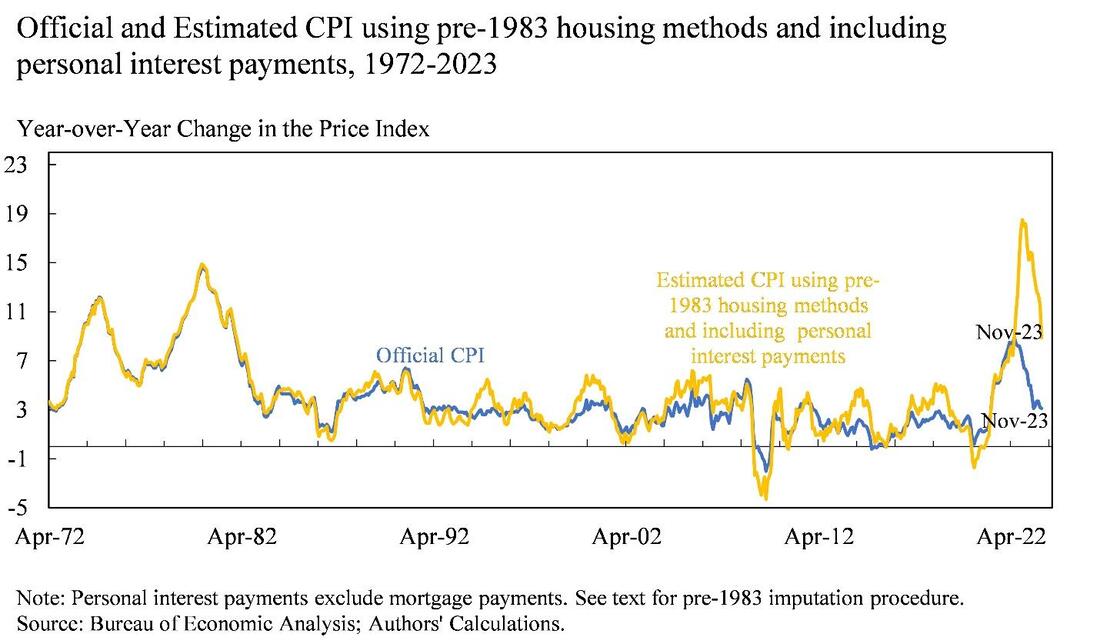 Just as inflation is always and everywhere a monetary phenomenon, deficits and high taxes are always and everywhere a spending problem. David Boaz at Cato Institute has noted how this problem is caused by both Republicans and Democrats. To control this fiscal and monetary crisis, the U.S. needs a fiscal rule like the Responsible American Budget (RAB) with a maximum spending limit based on the rate of population growth plus inflation. This was recently released as part of Americans for Tax Reform’s Sustainable Budget Project, highlighting this approach’s benefits at the federal, state, and local levels. If Congress had followed this approach from 2004 to 2023, Figure 4 shows tax receipts, spending, and spending adjusted for only population growth plus chained-CPI inflation. Instead of an (updated) $20.2 trillion national debt increase, there could have been only a $700 billion debt increase for a $19.5 trillion swing in a positive direction that would have substantially reduced the cost of this debt to Americans. The Republican Study Committee recently noted the strength of this type of fiscal rule in its FY 2025 “Fiscal Sanity to Save America.” To top this off, the Federal Reserve should follow a monetary rule so that the costly discretion stops creating booms and busts. Figure 6: Federal Budget Gap Shrinks If Spending Limited to Population Growth Plus Inflation 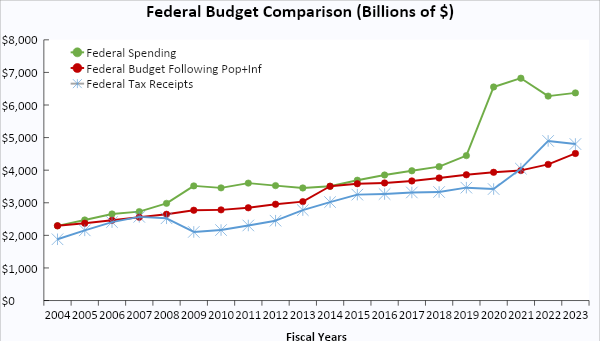 Bottom Line
Bidenomics has been a failure and the policy approach must be redirected to pro-growth policies that shrink government rather than big-government, progressive policies. It’s time for a limited government with sound fiscal and monetary policy that provides more opportunities for people to work and have more paths out of poverty. Recommendations:
Originally published at Texans for Fiscal Responsibility. While the Texas economy continues to be one of the best in the country, the state must not rest on its laurels. This is because other states are becoming more competitive, and recent efforts by the Texas Legislature have headed Texas in a more progressive, California-style direction. But let’s see what the data tell us about the Lone Star State. 1) Texas had the 9th largest in-migration from other states in 2023.
Figure 1: Texas had the Ninth Best Percent Increase in Net Domestic Migration in 2023 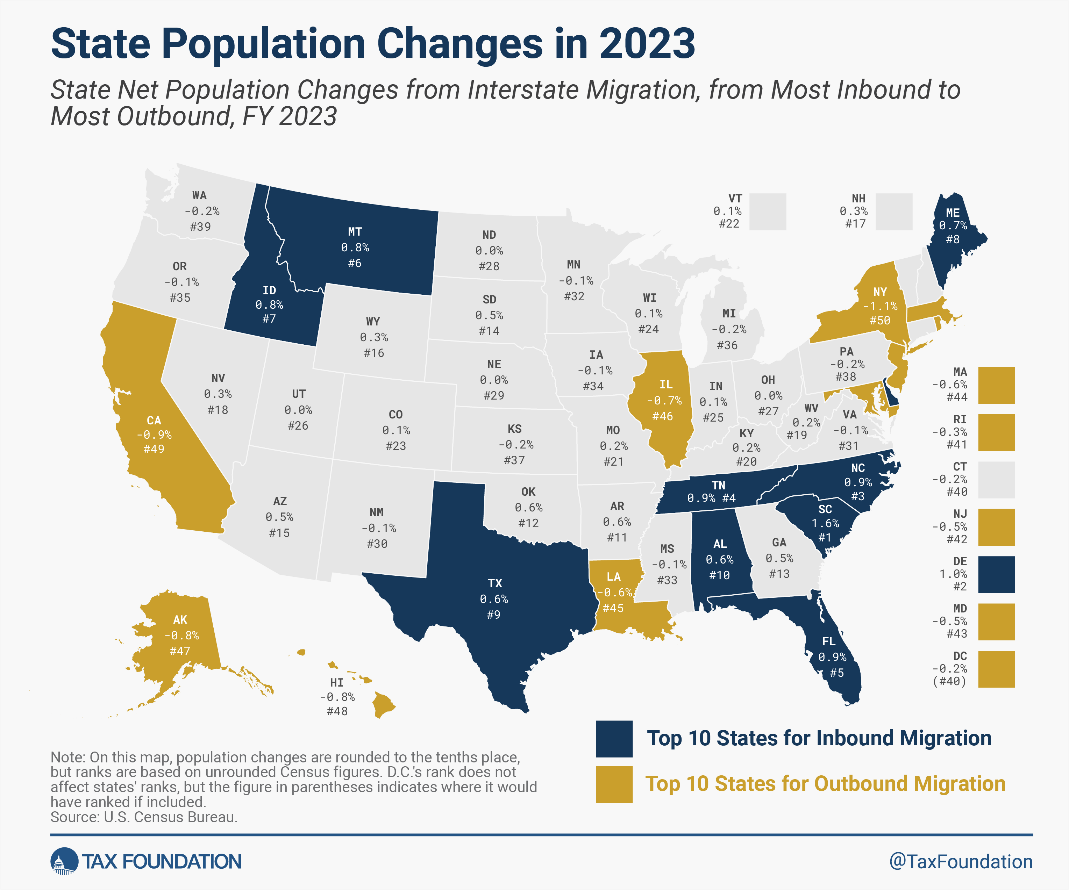 Source: Tax Foundation
2) Texas’ labor market continues to improve but remains well below where it was in 1999.
3) Texas’ employment has been up for 43 of the last 44 months.
4) Texas’ workers gain jobs in most industries but some have lost purchasing power.
Figure 2. Texas’ Labor Market by Industry 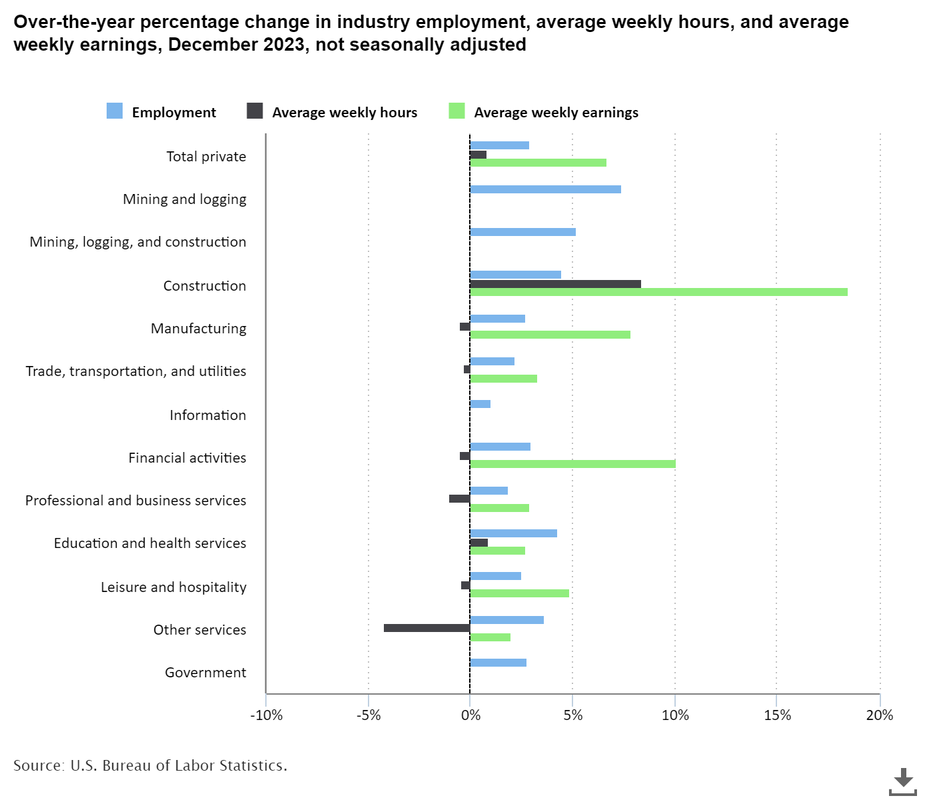 Source: U.S. Bureau of Labor Statistics 5) Economic growth has picked up, but personal income lags the U.S. average.
Figure 3: Real Gross Domestic Product by State in Q3:2023 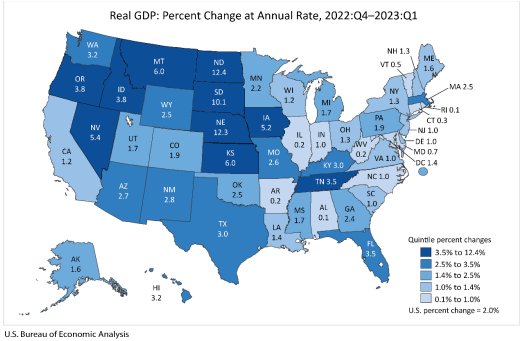 Source: U.S. Bureau of Economic Analysis
Bottom Line:
These Pro-Growth Opportunities Include:
Strengthening the Texas Model will help Texans better resist D.C.’s overreach, be more competitive with other states, and, more importantly, flourish more for generations to come. Let’s start today! Texas lost jobs in October and faces major headwinds with a weak U.S. economy and a poor performance by this year’s 88th Legislature. There is a better way.
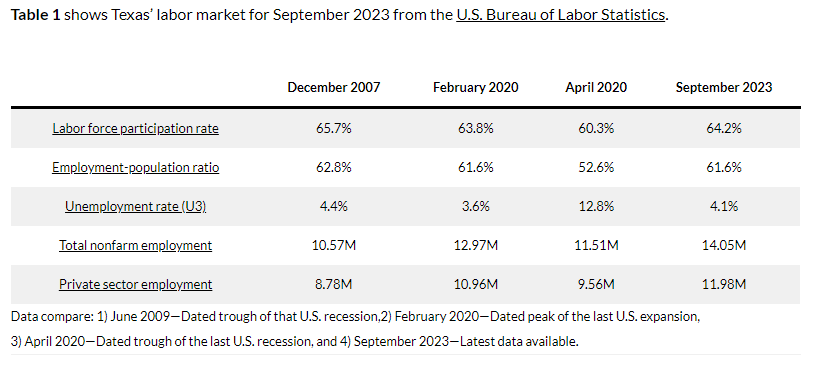
Free-market capitalism is the best path to let people prosper, as it is the best economic institution that supports jobs and entrepreneurship for more people to earn a living, gain skills, and build social capital. Table 1 shows Texas’ labor market for October 2023 from the U.S. Bureau of Labor Statistics. These data compare the following important dates: 1) June 2009—Dated trough of that U.S. recession, 2) February 2020—Dated peak of the last U.S. expansion before the COVID-19 shutdowns, 3) April 2020—Dated trough of the last U.S. recession, and 4) October 2023—Latest data available. 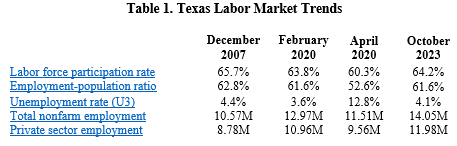 The labor market declined last month continuing a weakening trend in Texas.
The economy continues to expand in Texas though there are headwinds.
As Texans face an affordability crisis from high inflation and high property taxes and an uncertain future with the U.S. economy likely in a deepening recession, the Legislature provided some tax relief but not nearly enough because of excessive spending.
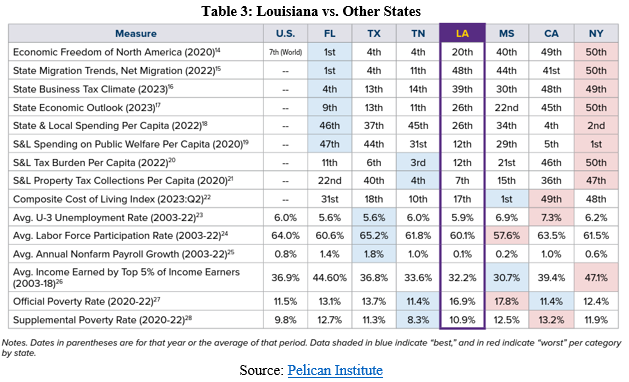
Strengthening the Texas Model will help Texans better resist D.C.’s overreach, be more competitive with other states, and, more importantly, flourish more for generations to come.  Our new report highlights Louisiana’s economic situation based on the most recent data. The report is based on several key factors that indicate how the economy, labor market, and public policy influence the lives of everyday Louisianans. While some of these data indicate a relatively strong labor market–such as the historically low unemployment rate–there are underlying factors showing Louisiana’s economic struggle. Our Louisiana Comeback will happen through reforms that remove government barriers, bring jobs and opportunity back to Louisiana, and let people prosper. We must decide: Will we continue to hold on to the status quo (which hasn’t done us any favors), or will we embrace the significant reforms necessary to bring jobs and opportunity to Louisiana? We need the latter. Read the full two-pager: Economic Report Oct 2023 Originally published by Pelican Institute.  At first glance, you might think that Louisiana’s economy is doing great. After all, the state’s September 2023 jobs report shows record lows for the unemployment rate at 3.3% and and people unemployed at 67,930. Louisiana Governor John Bel Edwards cheered these data in a press release: “Louisiana continues to set records for low unemployment. We’ve had 30 consecutive months of job growth and have added nearly 280,000 jobs since the worst of the pandemic. In fact, our employment levels are now higher than they were before COVID. Experts believe that our bipartisan work to grow and diversify our economy will benefit Louisiana for years to come. Economist Dr. Loren Scott recently predicted that Louisiana will add more than 80,000 jobs over the next two years. And we’ve done it all while overcoming historic natural disasters and a state government budget crisis. I have never been more optimistic about Louisiana than I am today.” But does what you hear in the media or by some politicians match reality? Let’s dive into the data to see how things are going for Louisianans. We should know that the Pelican State has many fantastic resources but too many failed public policies that keep Louisianans from reaching their full potential. This has been the case for a while, but most recently, the jobs reports indicate slowing employment growth and a declining labor force. Work matters, as it brings about dignity and self-sufficiency and leaves fewer people needing help from government safety net programs. These data below show that while the labor market data can look good on the surface, there are many real problems facing Louisianans that need to be addressed by state leaders. Fortunately, the Pelican Institute’s “Comeback Agenda,” including our fiscal reform plan, supports ways to overcome these challenges. Here are key issues in Louisiana’s economy. Table 1 provides Louisiana’s labor market data for important dates from the U.S. Bureau of Labor Statistics. These dates are December 2007, when the Great Recession started; February 2020, when the last expansion peaked before the COVID-19-related shutdowns; April 2020, when the shutdown recession ended; and September 2023, for the latest data available. 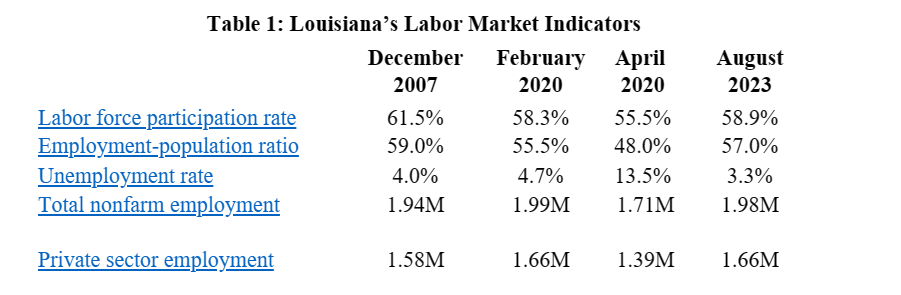 The unemployment rate would be 4.9% if Louisianans hadn’t left the state since pre-COVID. The unemployment rate is calculated using data from the household survey and isn’t a great measure of the labor market. This is because unemployment in the numerator and the labor force in the denominator are volatile measures as people enter and exit Louisiana and the labor force. Considering data from pre-COVID to compare with the Governor’s statement, the working-age population is down by 36,329 to 3.5 million. Even though the labor force is up 1,566 since then, the many people who have left the state keep the unemployment rate lower than otherwise. If we include the departed population in the labor force and unemployment, the unemployment rate would be 4.9%, substantially higher than the reported 3.3%. Moreover, if the working-age population hadn’t declined, the labor force participation rate would be 59.3% instead of the 58.9% rate today. Louisiana’s employment has not increased for 30 consecutive months. While the Governor is correct that there have been about 280,000 jobs since pre-COVID, there have not been “30 consecutive months of job growth.” The payroll survey shows that nonfarm employment is up 270,300 and the household survey shows that employment is up 295,065 since February 2020. There was an increase in nonfarm employment by 8,900 jobs in September (6th most in percentage terms of any state). But this was after cumulative losses of 3,600 jobs during June and July for an increase of just 18,100 jobs over the last four months. Over the last 30 months, there have been seven months with declining net jobs in the payroll survey and nine months with declines in the household survey, which has had four straight months of declines for a total of 17,564 fewer people employed in that period. So, Louisianans have actually been struggling over the last 30 months. Louisiana will add a projected 80,000 more jobs over the next two years, indicating slower job creation. Considering nonfarm employment over a longer period, it is up by 46,000 jobs from a year ago (20th most in the country) for a 2.4% increase (12th fastest). This would result in 92,000 jobs added over the next two years if this pace continued, but the Governor says one projection is just 80,000 jobs added over that period, indicating slower job creation. Also, nonfarm employment is down by 13,700 jobs since February 2020 (one of only a few states that have not regained lost jobs since then). Jobs in the private sector increased by 520 last month to 1.66 million, and government employment increased by 8,300 jobs to 320,500. There is growing weakness in the labor market, with some job losses and average weekly earnings not rising as fast as CPI inflation of 3.7% in many industries (Figure 1). 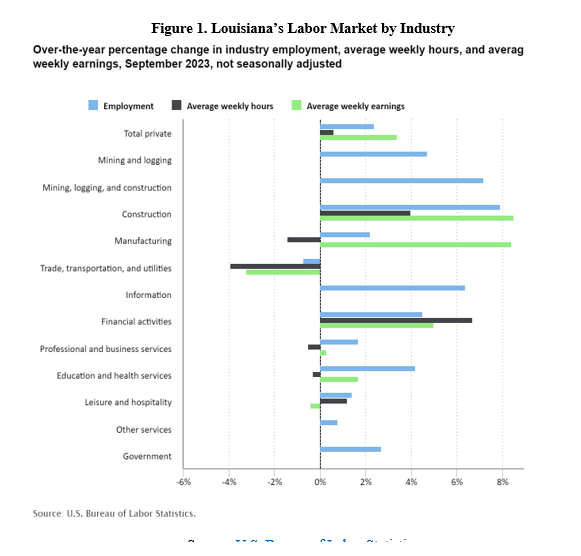 Another weakness is economic growth. Table 2 shows how the U.S. and Louisiana economies performed since 2020, as reported by the U.S. Bureau of Economic Analysis. 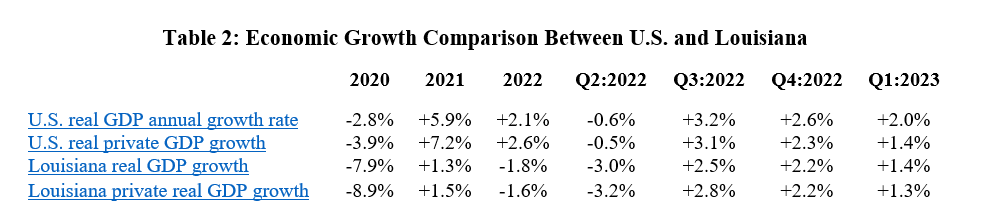 The steep declines were during the shutdowns in 2020 in response to the COVID-19 pandemic, which was when the labor market suffered most. Figure 2 shows how the increase in real GDP in Louisiana of +1.4% in Q1:2023 ranked 31st in the country to $289.9 billion, after an annual decline in economic output by -1.8% in 2022 which was the second worst in the country.  The BEA also reported that personal income in Louisiana grew at an annualized pace of +6.2% (ranked 27th) to $258.5 billion in Q1:2023 (above +5.1% U.S. average). There was personal income growth of 0.0% in 2022, ranking 50th of the states. Compared with neighboring states based on several measures there continue to be major concerns in Louisiana (see Table 3). 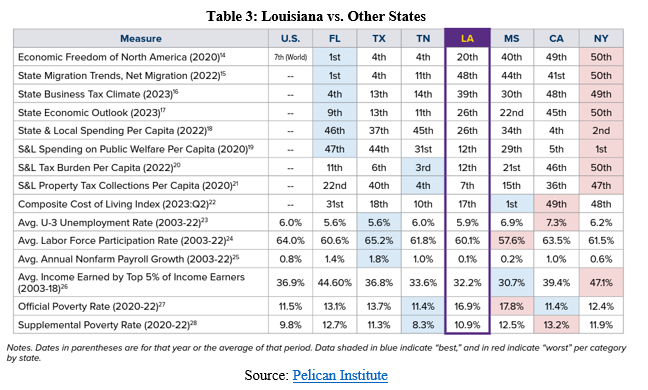 Bottom Line: Louisiana’s economy is weak when it comes to the labor market and economic growth and when compared with other states. Bold, transformational reforms can unleash the potential of Louisianans and make the state more competitive.
Originally published at Pelican Institute. Texas has been a leader in job creation. But Texas faces major headwinds as this year’s 88th Legislature has looked more like California than what Texans expect. There is a better way.
 The labor market continues to improve in Texas even as there are some weaknesses.
Originally published at Texans for Fiscal Responsibility. Highlights
 Overview
The Bureau of Labor Statistics recently released its U.S. jobs report for April 2023, which was another mixed report with some strengths but many weaknesses.
Economic Growth The U.S. Bureau of Economic Analysis recently released the third estimate for economic output for Q2:2023.
 The latest indicator of this concern is U.S. real GDP was revised lower to just a 2.1% increase last quarter. Moreover, previous quarters were revised lower and there continue to be indications of a recession in early 2022 from two consecutive quarters of declining economic activity and relatively weak thereafter. Another measure of economic activity is the real average of GDP and GDI which accounts for domestic production and income. It increased by just 1.4% to $22.1 trillion. This important measure has declined in half of the last six quarters, increasing this value by only 1.2% since the first quarter of 2022, which is likely when the recession started. Meanwhile, the federal budget deficit is growing faster because of overspending and declining tax collections from a weak economy (See Figure 2). The national debt has ballooned to $33.5 trillion, and net interest payments on the debt will soon be a top federal expenditure of at least $1 trillion. Adding to these fiscal challenges are other large, unnecessary expenditures of taxpayer money. 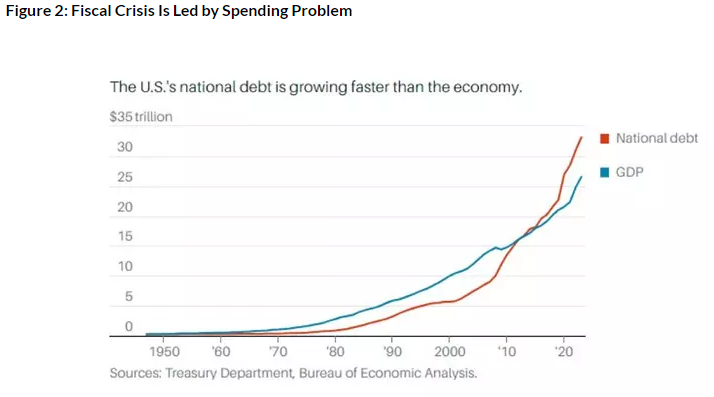 The Fed has monetized, or printed, much of the new debt to keep interest rates artificially lower than where the market would have them. This created higher inflation as there was too much money chasing too few goods and services. And this has been exacerbated as production has been overregulated and overtaxed and workers have been given too many handouts. The Fed will need to cut its balance sheet (total assets over time) more aggressively if it is to stop manipulating markets (see this for types of assets on its balance sheet) and persistently tame inflation. The current annual inflation rate of the consumer price index (CPI) has been cooling since a peak of +9.1% in June 2022 but remains elevated at 3.7% in September 2023, which remains too high as are other key measures of inflation. Just as inflation is always and everywhere a monetary phenomenon, deficits and taxes are always and everywhere a spending problem. David Boaz at Cato Institute has noted how this problem is from both Republicans and Democrats (See Figure 3). 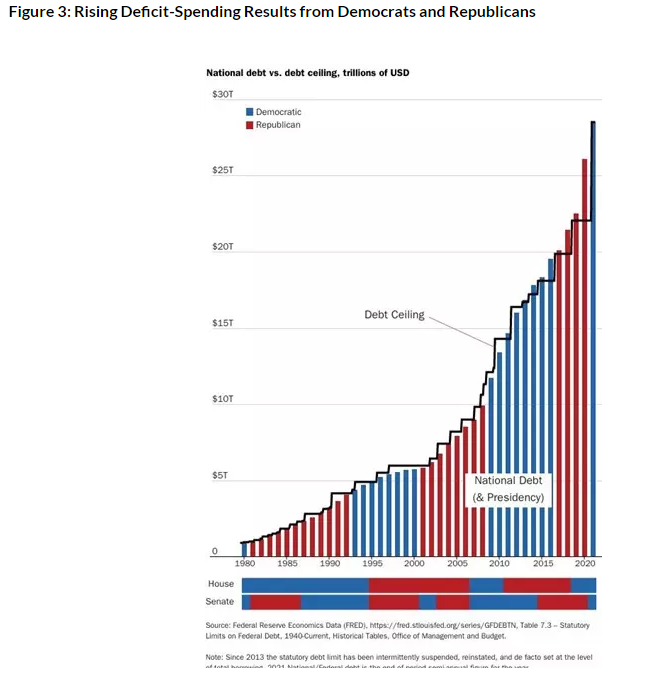 In order to get control of this fiscal crisis which is contributing to a monetary crisis, the U.S. needs a fiscal rule like the Responsible American Budget (RAB) with a maximum spending limit based on the rate of population growth plus inflation. This was recently released as part of Americans for Tax Reform’s Sustainable Budget Project. If Congress had followed this approach from 2003 to 2022, Figure 4 shows tax receipts, spending, and spending adjusted for only population growth plus chained-CPI inflation. Instead of an (updated) $19.0 trillion national debt increase, there could have been only a $500 billion debt increase for a $18.5 trillion swing in a positive direction that would have substantially reduced the cost of this debt to Americans. The Republican Study Committee recently noted the strength of this type of fiscal rule in its FY 2023 “Blueprint to Save America.” And to top this off, the Federal Reserve should follow a monetary rule so that the costly discretion stops creating booms and busts. 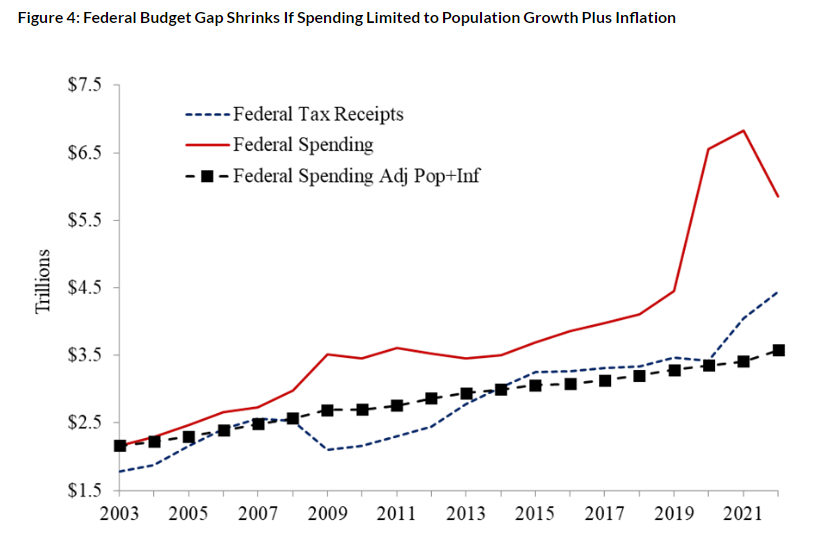 Bottom Line
The stagflationary destruction will continue given the “zombie economy” and the unraveling of the banking sector which will hit main street hard. Instead of passing massive spending bills, the path forward should include pro-growth policies that shrink government rather than big-government, progressive policies. It’s time for a limited government with sound fiscal and monetary policy that provides more opportunities for people to work and have more paths out of poverty. Recommendations:
This was originally posted at Texans for Fiscal Responsibility.  What is going on in Louisiana’s economy? How is the labor market doing for Louisianans? What you hear in the media or by politicians may not always match reality. The Pelican State has many fantastic resources with educated people, eccentric culture, robust ports, abundant oil and gas production, and much more. But Louisianans can’t reach their full potential and flourish because of failed public policies, highlighted by job losses in two of the last three months and many still out of the labor force. The Pelican Institute’s “Comeback Agenda,” which includes our recently released tax and budget reform plan, provides a prosperous path forward. Let’s dive into the data, consider myths and realities, and note which policies would help.
Table 1 provides Louisiana’s key labor market data during important dates from the U.S. Bureau of Labor Statistics. These dates are December 2007, when the Great Recession started; February 2020, when the last expansion peaked before the COVID-19-related shutdowns; April 2020, when the shutdown recession ended; and August 2023, for the latest data available. 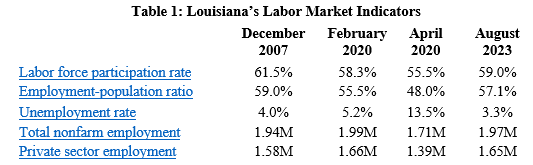 These data indicate strength on the surface, but how are Louisianans really doing? In August 2023, the unemployment rate declined to 3.3%, with 68,814 people unemployed; both are the state’s record lows. Louisiana Governor John Bel Edwards cheered these points as a testament to his policies since he took office in January 2016. But are these data worthy of praise? Let’s start by looking at how the unemployment rate is calculated: unemployed divided by the labor force, which includes the employed and unemployed. This calculation can show a lower unemployment rate in multiple ways, including fewer unemployed with the same labor force or fewer unemployed and fewer in the labor force. These data are collected from a survey of households across the state. The first reason would be considered by most as a positive result, while the latter as mostly negative if people stopped looking for work because they couldn’t find it or opted to receive temporary government assistance. There were massive increases in the number of Louisianans enrolled in social safety net programs over the last three years, which likely changed people’s incentive to work. But considering what has happened in the labor market since January 2016, the result is not as rosy. Since January 2016, Louisiana’s working-age population has declined by 29,650 to 3.5 million. The labor force has declined by 40,236 to 2.1 million. The number of unemployed has declined by 59,966 to 68,814. These data reflect how Louisiana has had people leave the state for years, including the third highest net out-migration in the country last year. The situation today is much different than in January 2016. If we account for the decline of 40,236 in the labor force and say those people didn’t leave the labor force and are unemployed (understanding some of them may find employment, but we don’t know how many would), then the unemployment rate would be 5.1%. This unemployment rate is lower than the 6% in January 2016 but 55% higher than the reported 3.3% rate today. Moreover, if the working-age population hadn’t declined, the labor force participation rate would be 59.7% instead of the 59.0% rate today. Work matters, as it brings about dignity and self-sufficiency and leaves fewer people needing help from government safety net programs. These calculations show that while the labor market data can look good on the surface, there are many real problems facing Louisianans that need to be addressed by state leaders. There are obstacles imposed by the government that can be solved, and we need only look to Utah as an example of how states can do a better job of connecting citizens with employment and supportive services that lead to self-sufficiency.
Nonfarm employment is what economists most often report because the data are considered more consistent with the health of the labor market. This is collected from established businesses instead of households across the state. There was an increase in nonfarm employment by 7,400 jobs in August (9th most in percentage terms of any state). But this was after cumulative losses of 3,600 jobs during the prior two months for an increase of just 3,800 jobs over the last three months. Considering nonfarm employment over a longer period, it is up by 34,200 jobs from a year ago (23rd most in the country). But it is down by 20,900 since January 2016 and down by 28,000 since February 2020 (one of only ten states not to have regained all jobs since then). We can see where jobs are added in Louisiana by diving deeper into these data. Jobs in the private sector increased by 6,700 last month to 1.65 million, and government employment increased by 700 jobs to 316,600 last month. Compared with a year ago, the private sector added 29,600 jobs, and the government added 4,600 jobs. But the private sector is down by 8,700 since January 2016 and down by 13,600 jobs since February 2020. There is growing weakness in the labor market, with job losses and average weekly earnings not rising as fast as CPI inflation of 3.7% in many industries (Figure 1). 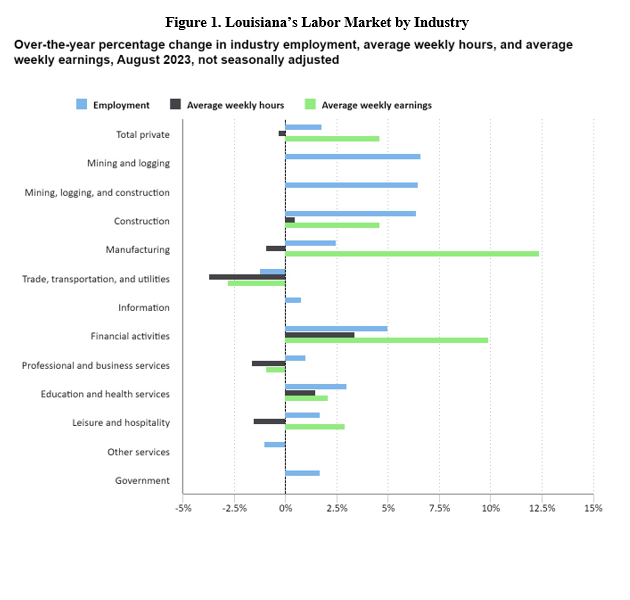 Overall, these data show the hardship that many Louisianans are facing across the state.
Table 2 shows how the U.S. and Louisiana economies performed since 2020, as reported by the U.S. Bureau of Economic Analysis. 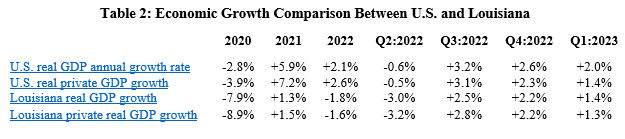 The steep declines were during the shutdowns in 2020 in response to the COVID-19 pandemic, which was when the labor market suffered most. Figure 2 shows how the increase in real GDP in Louisiana of +1.4% in Q1:2023 ranked 31st in the country to $289.9 billion, after an annual decline in economic output by -1.8% in 2022 which was the second worst in the country. 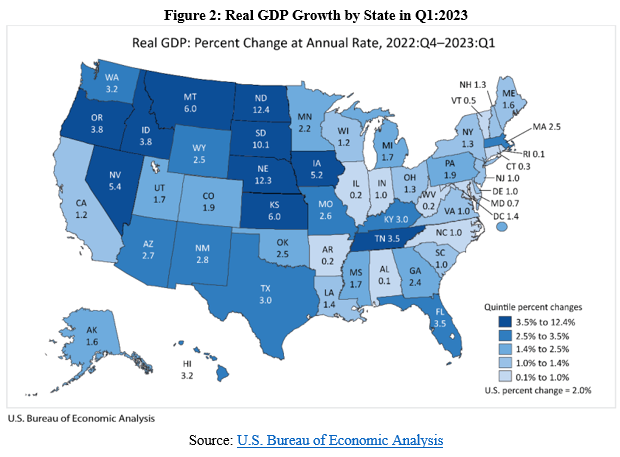 The BEA also reported that personal income in Louisiana grew at an annualized pace of +6.2% (ranked 27th) to $258.5 billion in Q1:2023 (above +5.1% U.S. average). There was personal income growth of 0.0% in 2022, ranking 50th of the states.
 Bottom Line: Louisiana’s economy is weak when it comes to the labor market; economic growth and reforms can unleash the potential of Louisianans and make the state more competitive.
Originally posted at Pelican Institute. Highlights
 Overview
Labor Market The Bureau of Labor Statistics recently released its U.S. jobs report for April 2023, which was another mixed report with some strengths but many weaknesses.
Economic Growth The U.S. Bureau of Economic Analysis recently released the second estimate for economic output for Q2:2023.
 Bottom Line
Recommendations:
Texas is a leader in job creation over the last year and since February 2020. But Texas faces major headwinds as the recently ended 88th Legislature looked more like California than what is expected from the free-market bastion of hope and prosperity in Texas.
The best path to let people prosper is free-market capitalism as it is the best economic institution that supports jobs and entrepreneurship for more people to earn a living, gain skills, and build social capital. Table 1 shows Texas’ labor market for July 2023 from the U.S. Bureau of Labor Statistics. 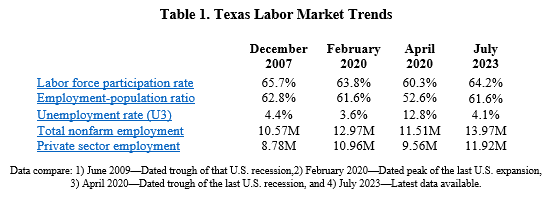 The labor market continues to improve in Texas even as there are some weaknesses remaining.
The economy continues to expand in Texas though there are headwinds.
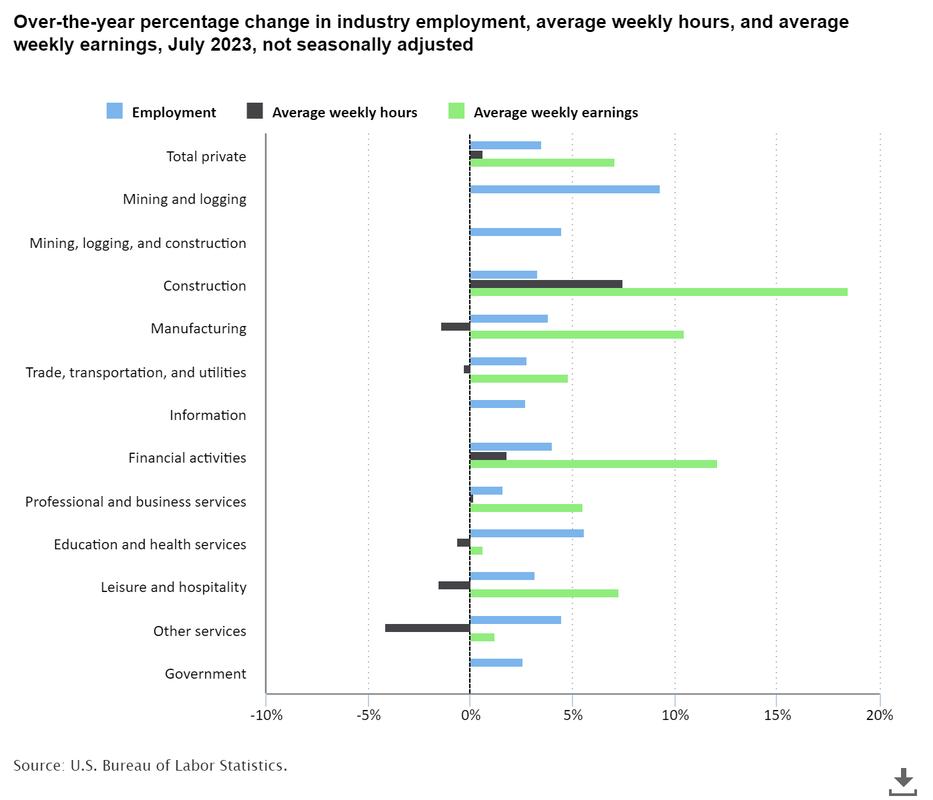
Strengthening the Texas Model will help Texans better resist D.C.’s overreach and flourish more for generations to come.  Key Point: Louisiana’s labor market shows improvement on the surface but there are underlying problems because of poor public policies which can be overcome with the Pelican Institute’s “Comeback Agenda.” Louisiana’s Labor Market: Table 1 shows Louisiana’s labor market information over time until the latest data for May 2023 which was released this month by the U.S. Bureau of Labor Statistics. The BLS report has two surveys which provide different information about the labor market. The payroll survey provides information on nonfarm employment based on responses by established employers for at least two years. The household survey provides responses from households for those who have a job and their demographics, which determines measures like the labor force participation rate and unemployment rate. 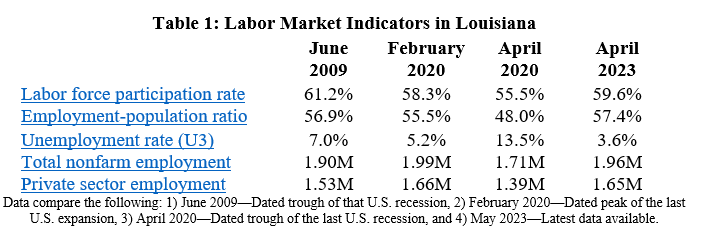 The payroll report shows that Louisiana’s net total nonfarm jobs increased by 4,600 jobs last month (+0.2%) to 1.96 million employed, which is 29,700 jobs below the pre-shutdown level in February 2020. Private sector employment was up by 4,400 jobs (+0.3%) to 1.65 million and government employment increased by 200 jobs (+0.1%) to 317,100 last month. Compared with a year ago, total employment was up by 48,400 jobs (+2.5%), with the private sector adding 41,700 jobs (+2.6%) and the government adding 6,700 jobs (+2.2%). This results in about 85% of all nonfarm jobs being in the productive private sector while 15% is in the government sector, which is the same as the share for the entire U.S. Figure 1 shows the percent changes in changes in employment, average weekly hours, and average weekly earnings by industry over the last year. The industries leading the way in increases in employment are mining and logging, construction, and financial activities while information and other services have the largest declines. Average weekly hours have declined or been flat in all industries with manufacturing, trade, and professional and business services declining the most. Average weekly earnings increased the most in manufacturing and education and health services but declined in most industries with trade and financial activities declining the most. These data show the dichotomy between those in the labor market as there are industries gaining employment but average weekly earnings are falling in most cases and are falling even further when adjusted for inflation, hurting many chances for Louisianans to make ends meet. 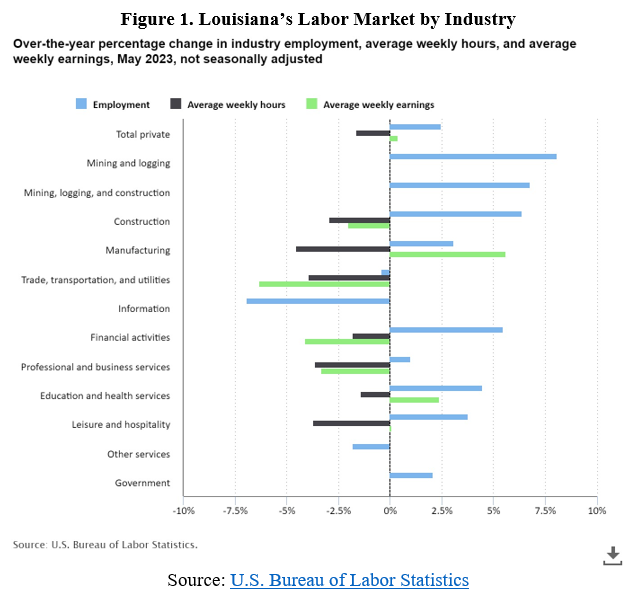 The household survey finds that the working-age population, defined as 16 to 64 years old, declined by another 894 people last month to 3.6 million, down 10,623 people over the last year, and down 34,106 people since February 2020. But the civilian labor force, defined as those who are working or looking for work, rose by 3,377 people to 2.1 million last month, 22,506 people over last year, and 27,910 people since February 2020. These figures result in a labor force participation rate of 59.6%, which is up from 58.8% from last year and up from 58.3% since pre-shutdown but well below the 61.2% rate in June 2009. But the number of employed has been increasing as it was up 2,363 over the last year, contributing to the slightly higher unemployment rate over the last year from 3.5% to 3.5%; but this rate remains lower than the 5.2% rate in February 2020. And a broader look at Louisiana’s labor market shows that Louisianans still face challenges with the continued decline in the working-age population which weighs on the labor-market shortage and long-term economic growth. And comparisons with neighboring states based on several labor market measures indicate concerns. Economic Growth: The U.S. Bureau of Economic Analysis (BEA) recently provided the real (inflation-adjusted) gross domestic product (GDP) and personal income for Louisiana and other states. Table 2 shows how the U.S. and Louisiana economies performed since 2020. The steep declines were during the shutdowns in 2020 in response to the COVID-19 pandemic, which was when the labor market suffered most. The increase in real GDP of +2.2% in Q4:2022 ranked 26th in the country, resulting in an annual decline in economic output by -1.8% in 2022 which was the second worst in the country. 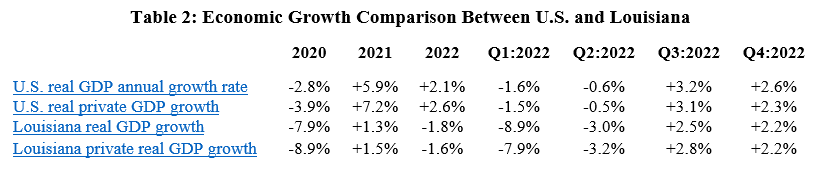 The BEA also reported that personal income in Louisiana grew at an annualized pace of +6.0% (ranked 32nd) in Q4:2022 (below +7.4% U.S. average). This resulted in personal income growth of 0.0% in 2022, ranking 50th of the states (see Figure 2). 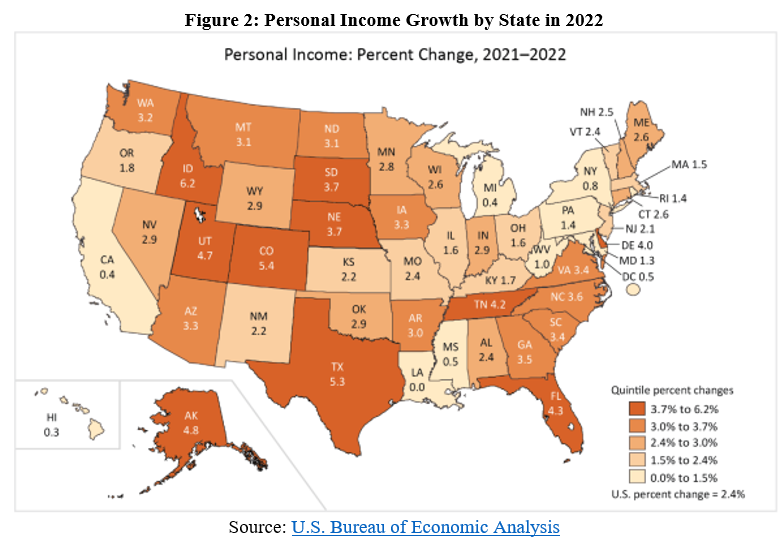 The growth rate for 2022 was driven by the negative $10 billion (-4.0-percentage points) in transfer payments from a decline in safety net payments as the expanded child tax credit expired and more people found jobs but increases in net earnings by $8.4 billion (+3.4-percentage points) and other income by $1.6 billion (+0.6-percentage point). Personal income per person in Louisiana increased by 0.08% to $54,622 last year, which ranked 42nd in the country but the increase was far below inflation.
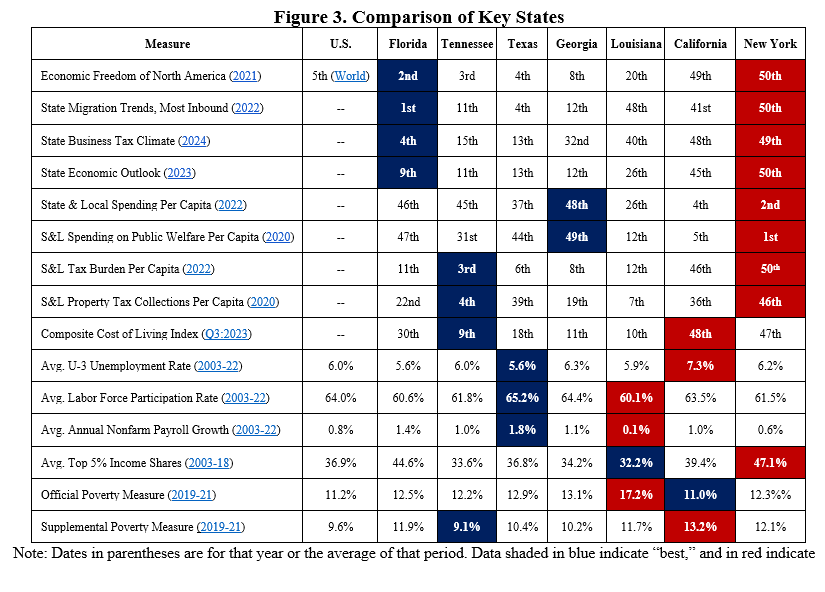
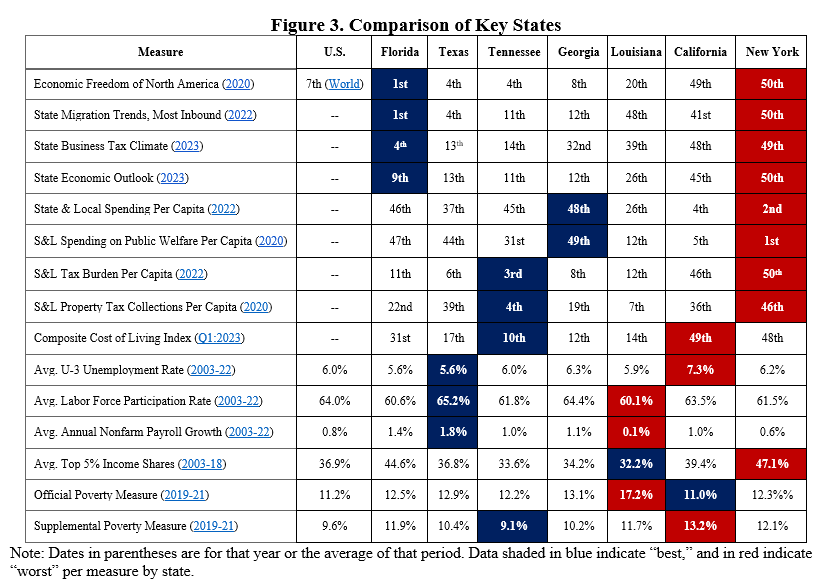
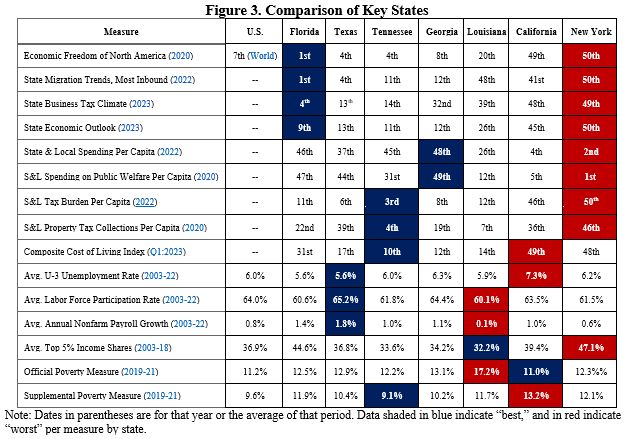
Bottom Line: More Louisianans gained jobs in April, but their pay hasn’t been keeping up with inflation in a stagnant economy. While the state improved its tax code in 2021, there was an irresponsible budget passed in 2023 which excessively grew spending, busted spending caps in FY23 and FY 24 and didn’t provide tax relief even with billions in excess tax revenue. Given these results, there is little reason to believe that there will be improvements in the state’s poor business tax climate, net outmigration of Louisianans, or the 19.6% poverty rate which ranks second highest in the country. Which pro-growth policies should be pursued instead? Refer to the Pelican Institute’s “Comeback Agenda” for policy recommendations that would turn the tide and provide opportunities for people to prosper. Originally published at Pelican Institute. Key Point: Texas is a leader in job creation over the last year and since February 2020. But Texas faces major headwinds as the recently ended 88th Legislature looked more like California than what is expected from the free-market bastion of hope and prosperity in Texas, which could change during special sessions but nothing certain yet. The path forward must be one of free-market capitalism instead of expanding the size and scope of government to let people prosper. Overview: Texas has reached a new record high in total nonfarm employment for the 20 straight months. The 88th Legislature ended on May 29 and went straight into a special session to provide property tax relief but that hasn’t happened yet, and the second special session ends on June 27. Instead, the Legislature passed the largest spending increase in the state’s history, the most money for corporate welfare, one of the largest expansions of safety nets, and no school choice. This was a huge, missed opportunity for Texas that will set up a fiscal cliff with so much spending, less competition with fiscally conservative states, and less opportunity for flourishing which combined will stop the Lone Star State from being a leader in the country. Labor Market: The best path to let people prosper is free-market capitalism as it is the best system that supports jobs and entrepreneurship for more people to earn a living, gain skills, and build social capital. Table 1 shows Texas’ labor market for May 2023. 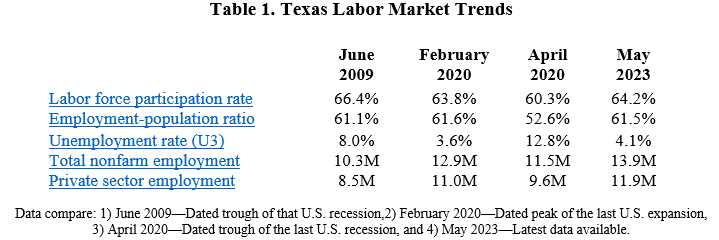 The payroll survey shows net nonfarm jobs in Texas increased by 51,000 last month, resulting in increases for 36 of the last 37 months, to bring record-high employment to 13.9 million. Compared with a year ago, total employment was up by 529,800 (+4.0%)--fastest growth rate in the country—with the private sector adding 472,000 jobs (+4.1%) to 11.9 million and the government adding 57,800 jobs (+2.9%) to 2.0 million. But there continued declining inflation-adjusted average weekly earnings in most industries in Texas (see Figure 1). 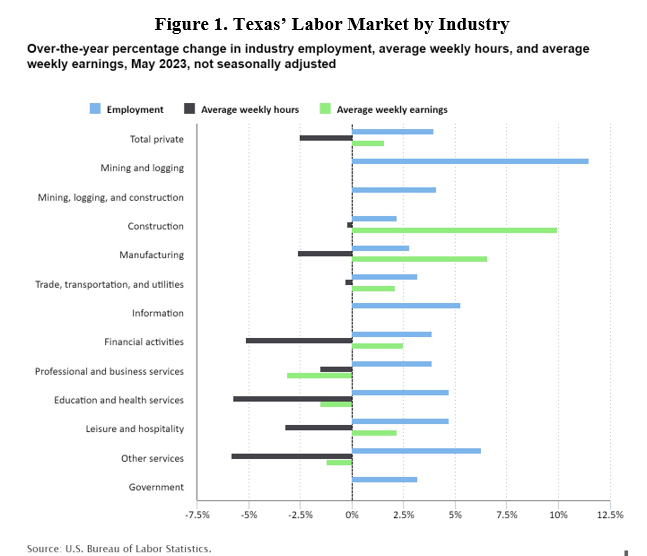 The household survey shows that the labor force participation rate is higher and employment-population rate is slightly lower than in February 2020, but the former is well below June 2009 at the trough of the Great Recession. The state’s unemployment rate of 4.1% is higher than the U.S. rate of 3.7% but this is weak indicator as it’s highly volatile based on changes in the labor force. Economic Growth: The U.S. Bureau of Economic Analysis (BEA) reported the real gross domestic product (GDP) by state for 2022. Figure 2 shows Texas had the fifth fastest real GDP growth of +3.4% to $1.9 trillion (above the U.S. average of +2.1% to $20.0 trillion). 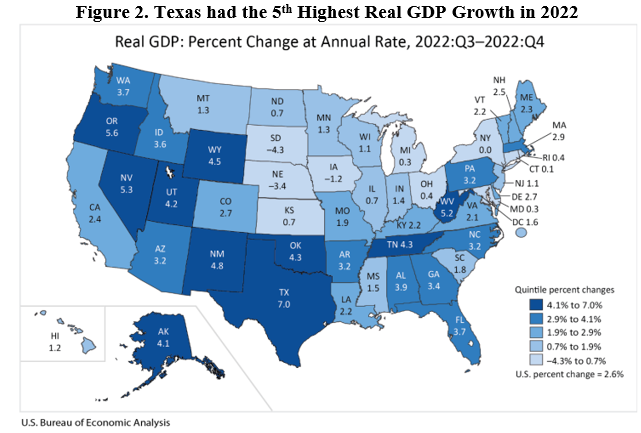 The BEA also reported that personal income in Texas grew by 5.3% to $1.9 trillion in 2022 which was the third highest in the country. This is behind Idaho (+6.2%) and Colorado (+5.4%) but well above the U.S. growth rate of 2.4% (to $21.8 trillion). Bottom Line: As Texans face an affordability crisis from high inflation and high property taxes and an uncertain future with the U.S. economy likely in a deepening recession, they need substantial relief to help make ends meet. Other states are cutting, flattening, and phasing out taxes, passing responsible budgets, and passing school choice, so Texas should have made bold reforms to support more opportunities to let people prosper, mitigate the affordability crisis, and withstand destructive policies out of D.C. Figure 3 provides a comparison of the size of government, economic freedom, and economic outcomes among the four largest states, Tennessee, Georgia, and Louisiana. 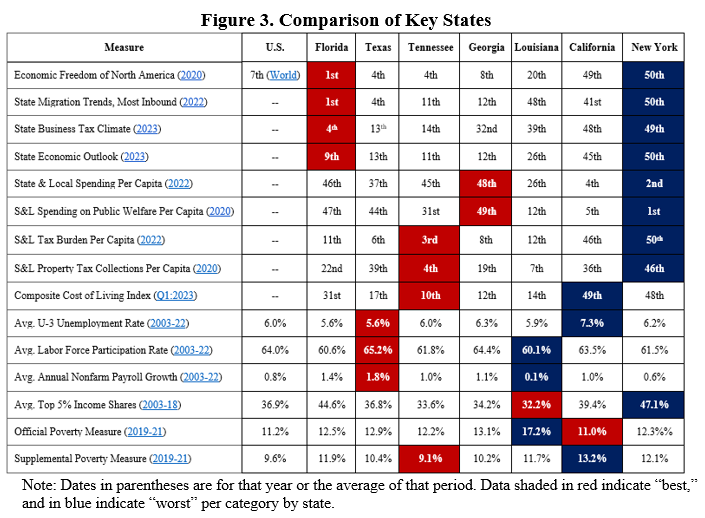 While Texas does relatively well, there is much more to do for more liberty and prosperity. Unfortunately, the Texas Legislature failed to achieve these needed policy objectives in the regular session of 2023 so Governor Greg Abbott (R) called them back to provide property tax relief which hasn’t yet so will have to call them back again for this along with passing school choice and should bring them back to eliminate corporate welfare and expansion of safety net programs.
Free-Market Solutions: The Texas Legislature should improve the Texas Model by:
Key Point: Louisianans aren’t reaching their full potential primarily because of bad public policies but that can change with the Pelican Institute’s “Comeback Agenda.” Louisiana’s Labor Market: Table 1 shows Louisiana’s labor market over time until the latest data for April 2023 from the U.S. Bureau of Labor Statistics. 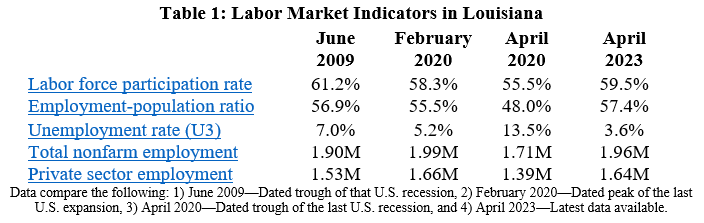 The establishment survey shows that net total nonfarm jobs in the state increased by 8,200 jobs last month (+0.4%), bringing total jobs to 33,700 jobs below the pre-shutdown level in February 2020. Private sector employment was up by 5,900 jobs (+0.4%) and government employment increased by 2,300 jobs (+0.7%) last month. Compared with a year ago, total employment was up by 48,400 jobs (+2.5%), with the private sector adding 41,400 jobs (+2.6%) and the government adding 7,000 jobs (+2.3%). The household survey finds that the working-age population declined by another 920 people last month, down 11,077 people over the last year, and down 33,212 people since February 2020. But the civilian labor force rose by 6,260 people last month, 16,090 people over last year, and 24,592 people since February 2020. These figures result in a labor force participation rate of 59.5%, which is up from 58.9% from last year and up from 58.3% since pre-shutdown but well below the 61.2% rate in June 2009. While the unemployment rate of 3.6% is substantially lower than the 5.2% rate in February 2020, a broader look at Louisiana’s labor market shows that Louisianans still face challenges (see Figure 1). These challenges include the continued decline in the working-age population which weighs on the labor-market shortage and long-term economic growth and comparisons with neighboring states based on several measures indicate concerns. 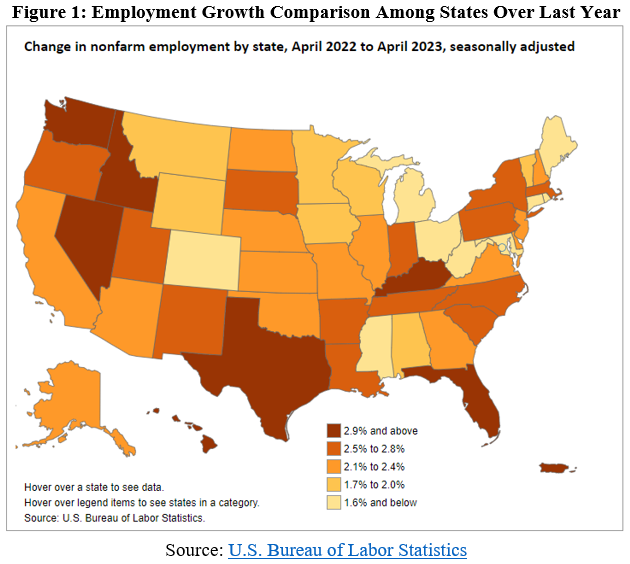 Economic Growth: The U.S. Bureau of Economic Analysis (BEA) recently provided the real (inflation-adjusted) gross domestic product (GDP) and personal income for Louisiana and other states in Figure 2. 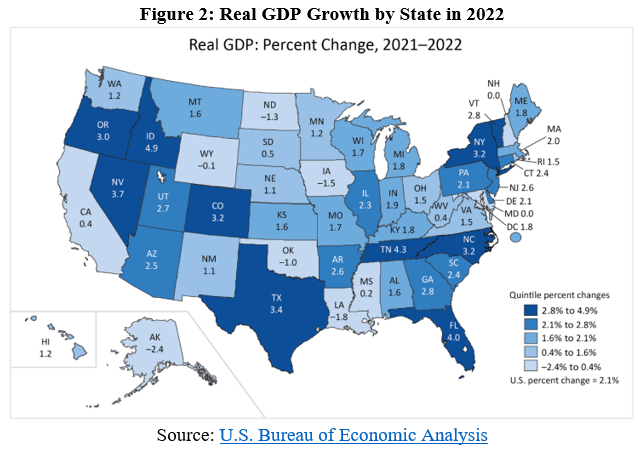 Table 2 shows how U.S. and Louisiana economies performed since 2020. The steep declines were during the shutdowns in 2020 in response to the COVID-19 pandemic, which was when the labor market suffered most. The increase in real GDP of +2.2% in Q4:2022 ranked 26th in the country, resulting in an annual decline in economic output by -1.8% in 2022 which was the second worst in the country. 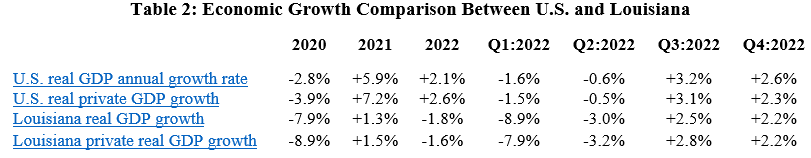 The BEA also reported that personal income in Louisiana grew at an annualized pace of +6.0% (ranked 32nd) in Q4:2022 (below +7.4% U.S. average). This resulted in personal income growth of 0.0% in 2022, ranking 50th of the states, driven by the negative $10 billion (-4.0-percentage points) in transfer payments from a decline in safety net payments as the expanded child tax credit expired and more people found jobs, but increases in net earnings by $8.4 billion (+3.4-percentage points) and other income by $1.6 billion (+0.6-percentage point). Personal income per person in Louisiana increased by 0.08% to $54,622 last year, which ranked 42nd in the country but the increase was well below inflation.
Bottom Line: More Louisianans gained jobs in April, but their pay hasn’t been keeping up with inflation in a stagnant economy. Economic freedom matters to human flourishing, but Louisiana ranks relatively low among the states in economic freedom and other measures. While the state improved its tax code in 2021, there’s a historic opportunity to ensure prosperity by doing more this session. The combination of spending restraint, not busting the spending caps, paying down debt, and putting money in the rainy day fund for tax relief now are essential. These steps would improve the state’s poor business tax climate, help curb the net outmigration of Louisianans, and help mitigate the 19.6% poverty rate that ranks second highest in the country. State and local policymakers should work to reverse this trend by passing pro-growth policies. Which pro-growth policies should be pursued? Refer to the Pelican Institute’s “Comeback Agenda” for policy recommendations related to the state’s budget and taxes, K-12 education, public safety, social safety nets and workforce development, technology and innovation, and reducing regulatory barriers. Originally published by Pelican Institute. Key Point: Texas is a leader in job creation over the last year and since February 2020 (Figure 1 by @SoquelCreek). But Texas will struggle to compete with other states or prosper more as the 88th Legislature passed the largest budget increase in the state’s history, passed the largest corporate welfare increases in the state’s history, passed the largest safety net increases in the state’s history, didn’t pass property tax relief, and didn’t pass school choice. Governor Greg Abbott called a special session to tackle property tax relief and border security with more special sessions likely to come. 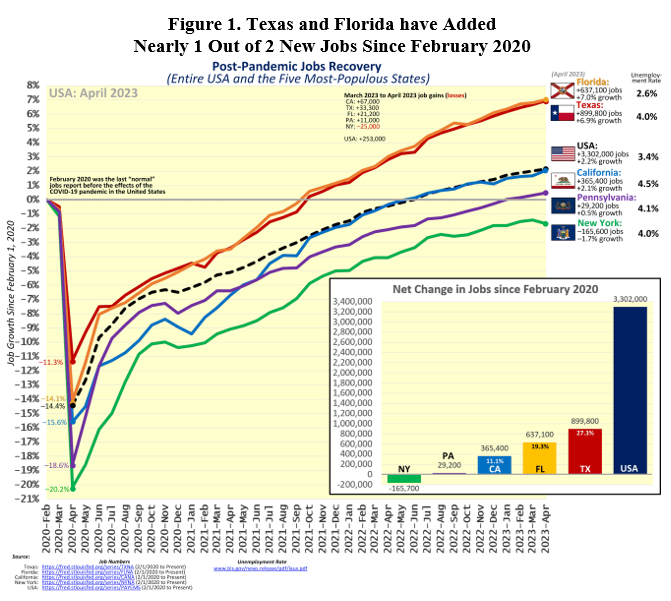 Overview: Texas has been a leader in the country’s economic recovery since the costly shutdown recession in Spring 2020. This includes reaching a new record high in total nonfarm employment for the 19th straight month. The current 88th Legislature ended the regular session on May 29 with a record surplus but chose to pass the largest spending and welfare increases in the state’s history without passing tax relief or school choice. This was a huge, missed opportunity for Texas that will set up a fiscal cliff with so much spending, less competition with fiscally conservative states, and less opportunity to let people prosper which combined will stop the Lone Star State from being a leader in the country. Fortunately, Governor Abbott called what is likely the first of multiple special sessions to tackle property tax relief (and border security). Labor Market: The best path to let people prosper is free-market capitalism as it is the best system that supports jobs and entrepreneurship for more people to earn a living, gain skills, and build social capital. Table 1 shows Texas’ labor market for April 2023. 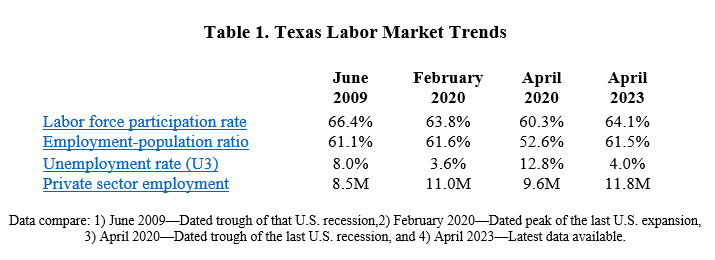 The establishment survey shows net nonfarm jobs in Texas increased by 33,300 last month, resulting in increases for 35 of the last 36 months, to bring record-high employment to 13.8 million. Compared with a year ago, total employment was up by 534,600 (+4.0%)--second fastest growth rate in the country to Nevada (+4.2%)—with the private sector adding 476,800 jobs (+4.2%) and the government adding 57,800 jobs (+2.9%). The household survey shows that the labor force participation rate is higher and employment-population rate is slightly lower than in February 2020, but the former is well below June 2009 at the trough of the Great Recession. The state’s unemployment rate of 4.0% is higher than the U.S. rate of 3.4% but this is weak indicator as it’s highly volatile based on changes in the labor force. There is also continued declining inflation-adjusted average earnings in Texas. Economic Growth: The U.S. Bureau of Economic Analysis (BEA) reported the real gross domestic product (GDP) by state for 2022. Figure 2 shows Texas had the fifth fastest real GDP growth of +3.4% to $1.9 trillion (above the U.S. average of +2.1% to $20.0 trillion). 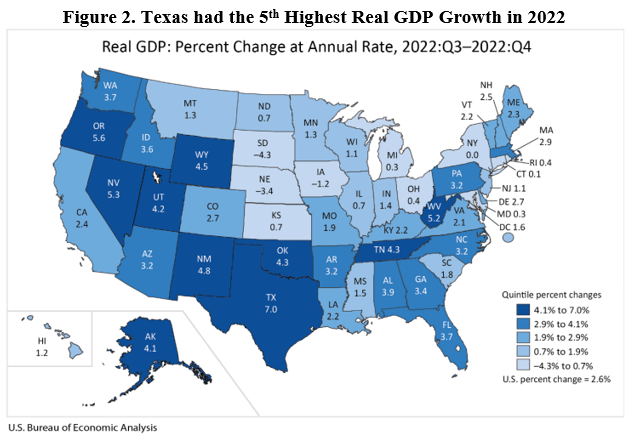 The BEA also reported that personal income in Texas grew by 5.3% to $1.9 trillion in 2022 which was the third highest in the country. This is behind Idaho (+6.2%) and Colorado (+5.4%) but well above the U.S. growth rate of 2.4% (to $21.8 trillion). Figure 3 shows personal income growth across the country. 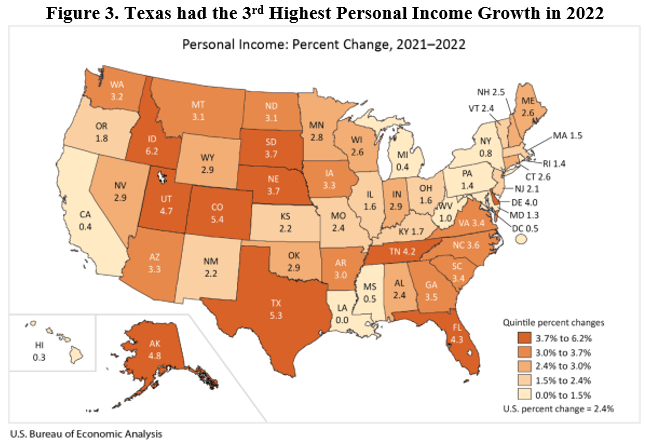 Bottom Line: As Texans struggle from high inflation and high property taxes and an uncertain future with the U.S. economy likely in a deepening recession, they need substantial relief to help make ends meet. Other states are cutting, flattening, and phasing out taxes, passing responsible budgets, and passing school choice, so Texas must make bold reforms to support more opportunities to let people prosper, mitigate the affordability crisis, and withstand destructive policies out of D.C. Figure 4 provides a comparison of the size of government, economic freedom, and economic outcomes among the four largest states and nearby Louisiana. While Texas does relatively well, there is much more to do for more liberty and prosperity. Unfortunately, the Texas Legislature failed to achieve these needed policy objectives in the regular session of 2023 so Governor Greg Abbott is calling them back where the Legislature should spend less, provide more in property tax relief, pass school choice, and reduce or eliminate corporate welfare and expansions of safety net programs. 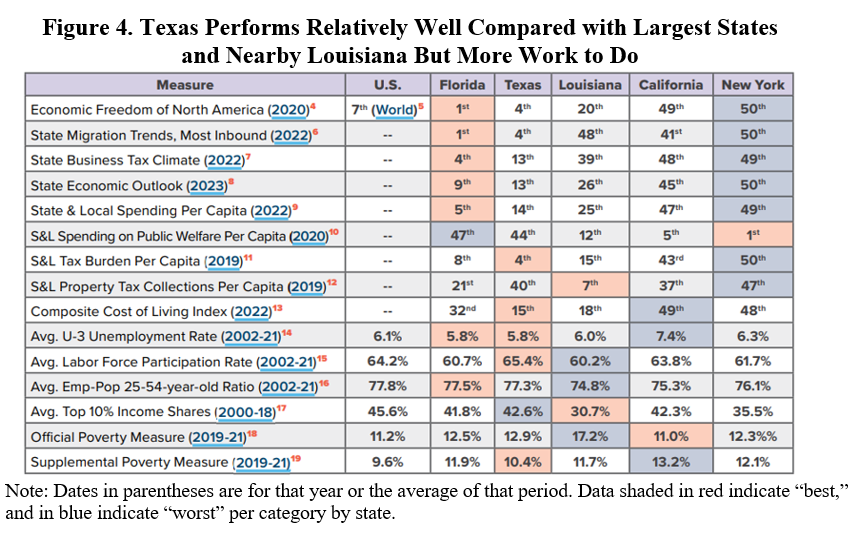 Free-Market Solutions: The Texas Legislature should improve the Texas Model by:
Key Point: The best way to let people prosper is free-market capitalism. Unfortunately, government has created a situation where inflation-adjusted average weekly earnings are down year-over-year for 25 straight months and economic growth is anemic. 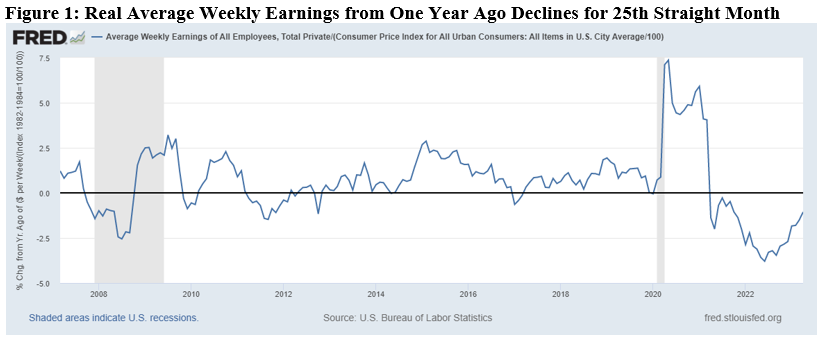 Overview: Government failures drove the “shutdown recession” and stagflationary period over the last three years that has plagued Americans, with more banking problems to come. This is fueled by the debt ceiling fight and elevated inflation that has also rocked the U.S. dollar. The answer are pro-growth policies of less spending by Congress, less regulation by the Biden administration, and less money printing by the Fed. Labor Market: The Bureau of Labor Statistic recently released its U.S. jobs report for April 2023, which was another mixed report with some strengths but many weaknesses. The establishment survey is the most reported shows there were +253,000 (+2.6%) net nonfarm jobs added in April to 155.7 million employees, which has increased by +4.0 million over the last year but just +3.3 million since February 2020. However, there were cumulative revisions in the prior two months of 149,000, so on net for that reduced the net increase to just +104,000 jobs indicating a weakening labor market. Over the last month, there were +230,000 jobs (+2.7%) added in the private sector and +23,000 jobs (+2.1%) added in the government sector. Most of the private sector jobs were added in the sectors of private education and health services (+77,000), professional and business services (+43,000), and leisure and hospitality (+31,000), which these three also led over the last 12 months. But wholesale trade lost -2,200 jobs last month while no industry had job losses over the last year. The household survey increased by +139,000 jobs to 161.0 million employed in April. There have been declines in net employment in four of the last 13 months for a total increase of +3 million since April 2022 and +2.3 million since February 2020, which both are 1 million below the jobs reported in the establishment survey. This could be because of reporting issues or the number of jobs each person has in the market. The official U3 unemployment rate ticked down to 3.4% and the broader U6 underutilization rate fell to 6.6%, which both are near or at historic lows. Since February 2020, the prime-age (25-54 years old) employment-population ratio is up by 0.3pp to 80.8%, prime-age labor force participation rate was 0.3-percentage point higher at 83.3%, and the total labor-force participation rate was 0.7-percentage-point lower at 62.6% with millions of people out of the labor force holding the U3 rate artificially low. Given some improvements, challenges remain for Americans as inflation-adjusted average weekly earnings were down (-1.1%) over the last year for the 25th straight month. Economic Growth: The U.S. Bureau of Economic Analysis’ recently released the 1st estimate for economic output for Q1:2023. Table 1 provides data over time for real total gross domestic product (GDP), measured in chained 2012 dollars, and real private GDP, which excludes government consumption expenditures and gross investment. Most of the estimates for Q4:2022 and growth in 2022 have been revised lower, providing more evidence that 2022 was a very weak economy if not a recession. 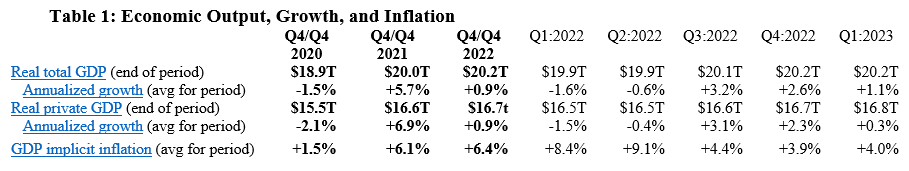 Economic activity has had booms and busts since the government-imposed COVID-related restrictions in response to the pandemic and poor fiscal and monetary policies that severely hurt people’s ability to exchange and work. In 2022, the first two quarters had declines in real total (and private) GDP, providing a reason to date recessions every time since at least 1950. While the second half of 2022 looked better, those two quarters were influenced by net exports and inventories that would have made the economy much weaker. For 2022, real total GDP growth is reported +2.1% year-over-year but measured by Q4-over-Q4 the growth rate was only +0.9%, which was the slowest Q4-over-Q4 growth during a recover on record. Then the anemic growth of just +1.1% in Q1:2023 provides more reason that this is an extended recession or at least stagflation. The Atlanta Fed’s early GDPNow projection on May 8, 2023 for real total GDP growth in Q2:2023 was +2.7% based on the latest data available, but this rate has been lowered in recent quarters. Considering the last expansion from June 2009 to February 2020, there was slower real private GDP growth in the latter part of that period due to higher deficit-spending, contributing to crowding-out of the productive private sector. Congress’ excessive spending since February 2020 led to a massive increase in the national debt by nearly +$7.6 trillion that would have led to higher market interest rates. This is yet another example of how there is always an excessive government spending problem as noted in Figure 2 with federal spending and tax receipts as a share of GDP no matter if there are higher or lower tax rates. 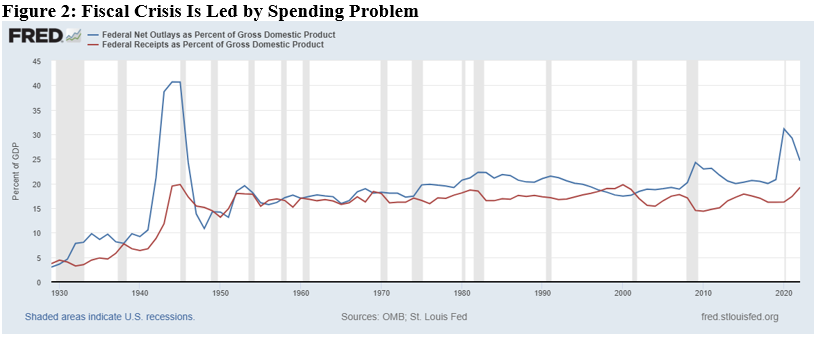 But the Fed monetized much of the new debt to keep interest rates artificially lower thereby creating higher inflation as there has been too much money chasing too few goods and services as production has been overregulated and overtaxed and workers have been given too many handouts. The Fed’s balance sheet exploded from about $4 trillion, when it was already bloated after the Great Recession, to nearly $9 trillion and is down only about 5.2% to $8.5 trillion since the record high in April 2022 after rising nearly $400 billion in March 2023 then down $200 billion since then. The Fed will need to cut its balance sheet (total assets over time) more aggressively if it is to stop manipulating markets (see this for types of assets on its balance sheet) and persistently tame inflation, as we may need deflation which hasn’t happened since 2009 given the rampant inflation over the last two years. The current annual inflation rate of the consumer price index (CPI) has been cooling since a peak of +9.1% in June 2022 but remains elevated at +4.9% in April 2023, which remains the highest since 2008 as do other key measures of inflation. After adjusting total earnings in the private sector for CPI inflation, real total earnings are up by only +2.6% since February 2020 as the shutdown recession took a huge hit on total earnings and then higher inflation hindered increased purchasing power. Just as inflation is always and everywhere a monetary phenomenon, deficits and taxes are always and everywhere a spending problem. David Boaz at Cato Institute notes how this problem is from both Republicans and Democrats. In order to get control of this fiscal crisis which is contributing to a monetary crisis, the U.S. needs a fiscal rule like the Responsible American Budget (RAB) with a maximum spending limit based on the rate of population growth plus inflation. If Congress had followed this approach from 2003 to 2022, the figure below shows tax receipts, spending, and spending adjusted for only population growth plus chained-CPI inflation. Instead of an (updated) $19.0 trillion national debt increase, there could have been only a $500 billion debt increase for a $18.5 trillion swing in a positive direction that would have substantially reduced the cost of this debt to Americans. The Republican Study Committee recently noted the strength of this type of fiscal rule in its FY 2023 “Blueprint to Save America.” And to top this off, the Federal Reserve should follow a monetary rule so that the costly discretion stops creating booms and busts. 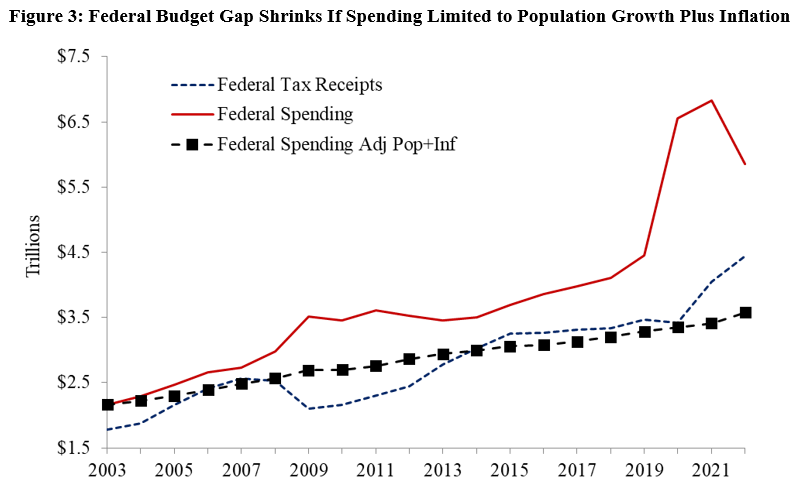 Bottom Line: Stagflation will continue with the a deeper recession this year given the “zombie economy” and the unraveling of the banking sector which will hit main street hard. Instead of passing massive spending bills, the path forward should include pro-growth policies that shrink government rather than big-government, progressive policies. It’s time for limited government with sound fiscal and monetary policy that provides more opportunities for people to work and have more paths out of poverty. There is some optimism with the House Republicans debt ceiling bill package, but it’s got an uphill battle to become law with Democrats in the Senate and White House so more must be done.
Recommendations:
Key Point: Texas remains a leader in job creation over the last year (chart below by @SoquelCreek) and set employment records across the state (see Figure 1) but Texans who are struggling from an affordability crisis would benefit from less spending, taxes, and regulations. 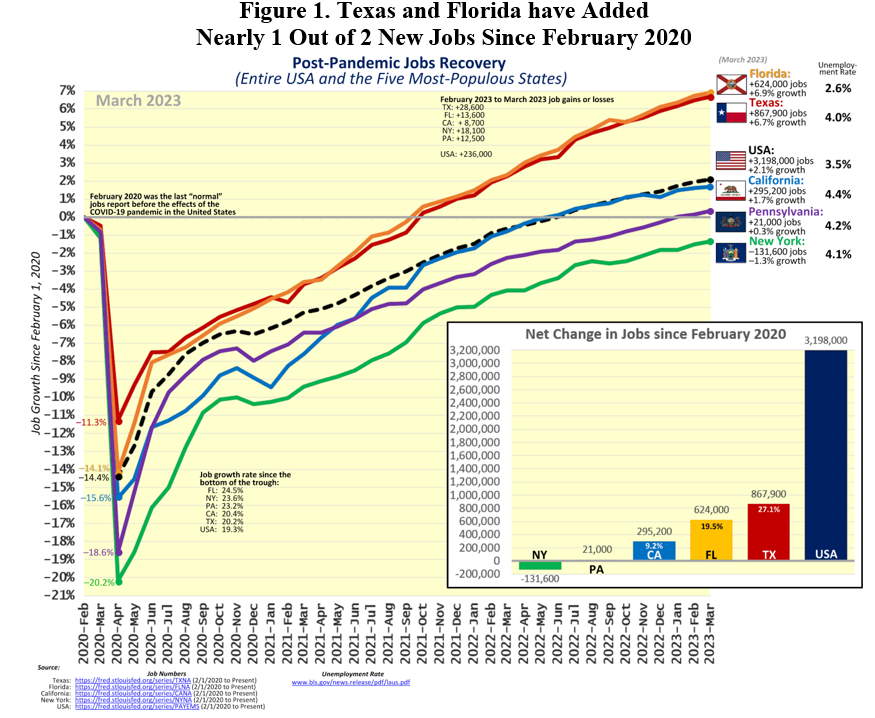 Overview: Texas is a leader in the country’s economic recovery since the costly shutdown recession in Spring 2020. This includes reaching a new record high in total nonfarm employment for the 18th straight month, leading exports of technology products for 21 consecutive years, and being home to the most Fortune 500 companies in the country. The current 88th Texas Legislature is winding down as legislator are spending too much, providing too little in property tax relief (see Figure 2), throwing taxpayer money at corporate welfare, and wavering on passing universal school choice. There’s a historic opportunity to ensure taxpayers have a bright future, Texas must lead and there’s time to do it but they must act quickly. 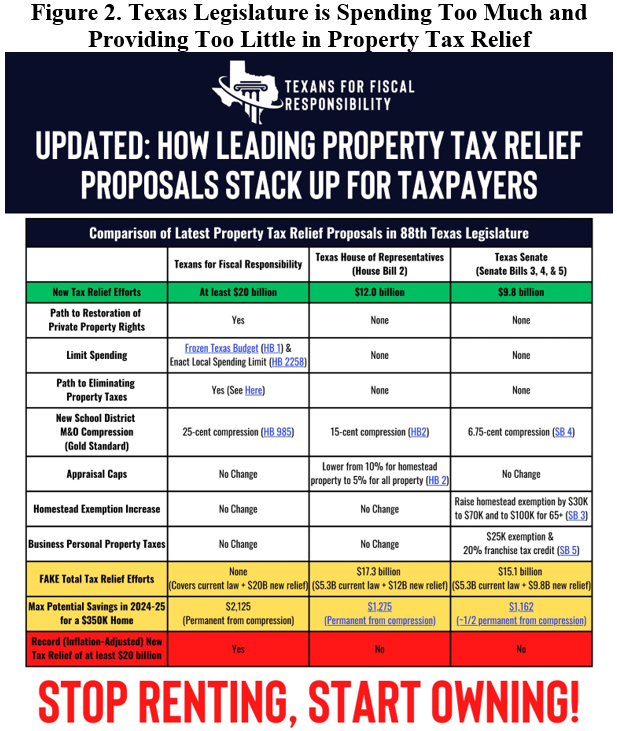 Labor Market: The best path to let people prosper is free-market capitalism as it is the best system that supports jobs and entrepreneurship for more people to earn a living, gain skills, and build social capital. Table 1 shows Texas’ labor market for March 2023. 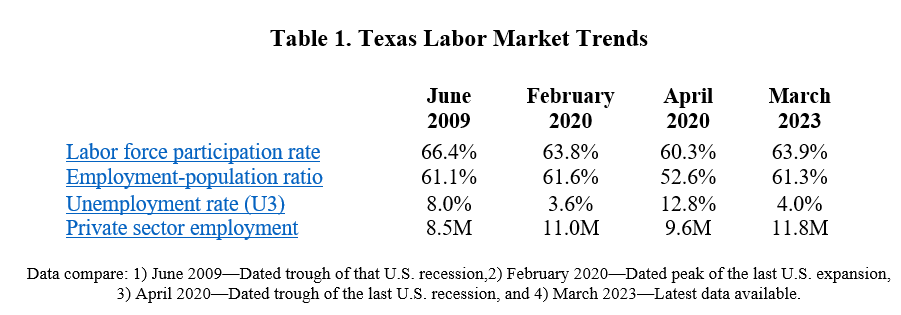 The establishment survey shows that net nonfarm jobs in Texas increased by 28,600 last month, resulting in increases for 34 of the last 35 months, to bring record-high employment to 13.8 million. Compared with a year ago, total employment was up by 575,100 (+4.3%)--third fastest growth rate in the country to Nevada (+5.0%) and Florida (+4.5%)—with the private sector adding 517,900 jobs (+4.6%) and the government adding 57,200 jobs (+2.9%). Figure 3 (h/t John Phelan) shows which states have created new jobs since February 2020, which red states are leading the way. 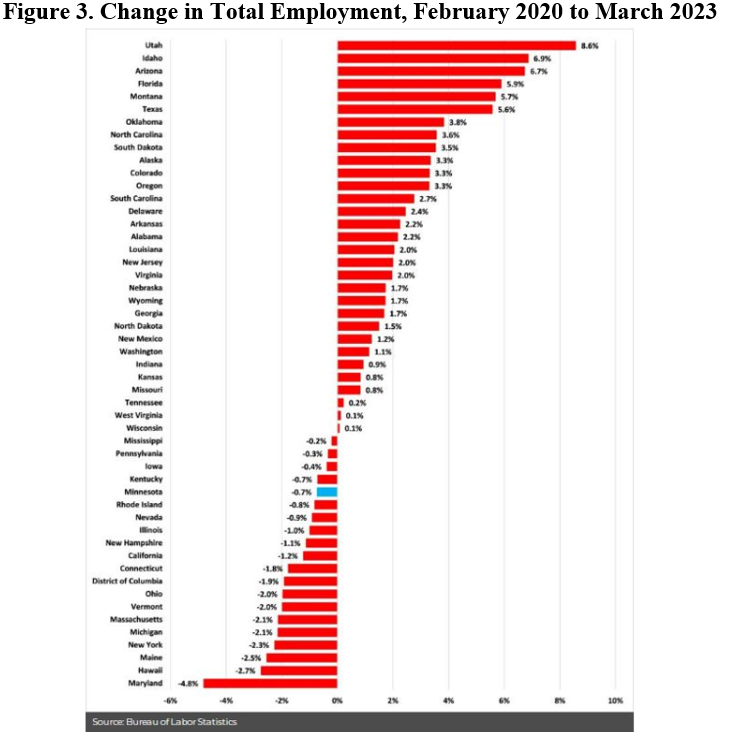 The household survey shows that the labor force participation rate and employment-population rate are now slightly higher than in February 2020, but the former is well below June 2009 at the trough of the Great Recession as there aren’t as many people in the labor force as a share of the working-age population. The state’s unemployment rate of 4.0% is higher than the U.S. rate of 3.5% but this is weak indicator as it’s highly volatile based on changes in the labor force. There is also continued declining inflation-adjusted average earnings in Texas. Economic Growth: The U.S. Bureau of Economic Analysis (BEA) reported the real gross domestic product (GDP) by state for Q4:2022 and 2022. Figure 4 below shows Texas had the fastest real GDP growth of +7.0% on an annualized basis to $1.92 trillion (above the U.S. average of +2.6% to $20.18 trillion). 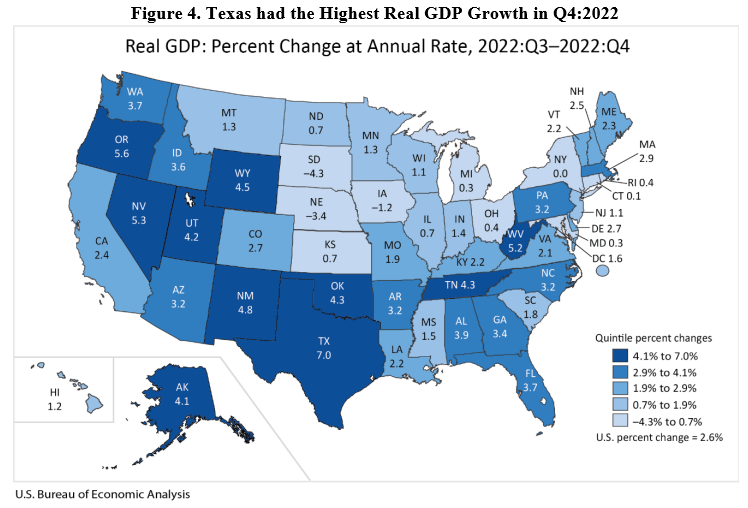 For the third straight quarter in 2022, Texas had one of the fastest growth rates in the country. For all of 2022, Texas’ real GDP growth rate was +3.4%, which was the fifth highest. The BEA also reported that personal income in Texas grew at an annualized pace of +7.7% in Q4:2022 (ranked 15th highest and faster than the U.S. average of +5.3%) but slower than the robust +8.4% in Q2:2022 (ranked 6th best and above the U.S. average of +7.4%) as job creation and inflated income measures found their way across the economy. Personal income growth in 2022 in Texas was +5.3% making it the third fastest in the country (Idaho with +6.2% and Colorado with +5.4%) with the U.S. growth of +2.4%. Bottom Line: As Texans face an affordability crisis from high inflation and high property taxes and an uncertain future with the U.S. economy likely in a deepening recession, they need substantial relief to help make ends meet. Other states are cutting, flattening, and phasing out taxes, so Texas must make bold reforms to support more opportunities to let people prosper, mitigate the affordability crisis, and withstand destructive policies out of D.C. Figure 5 provides a comparison of the size of government, economic freedom, and economic outcomes among the four largest states and nearby Louisiana. While Texas does relatively well, there is much more to do for more liberty and prosperity. 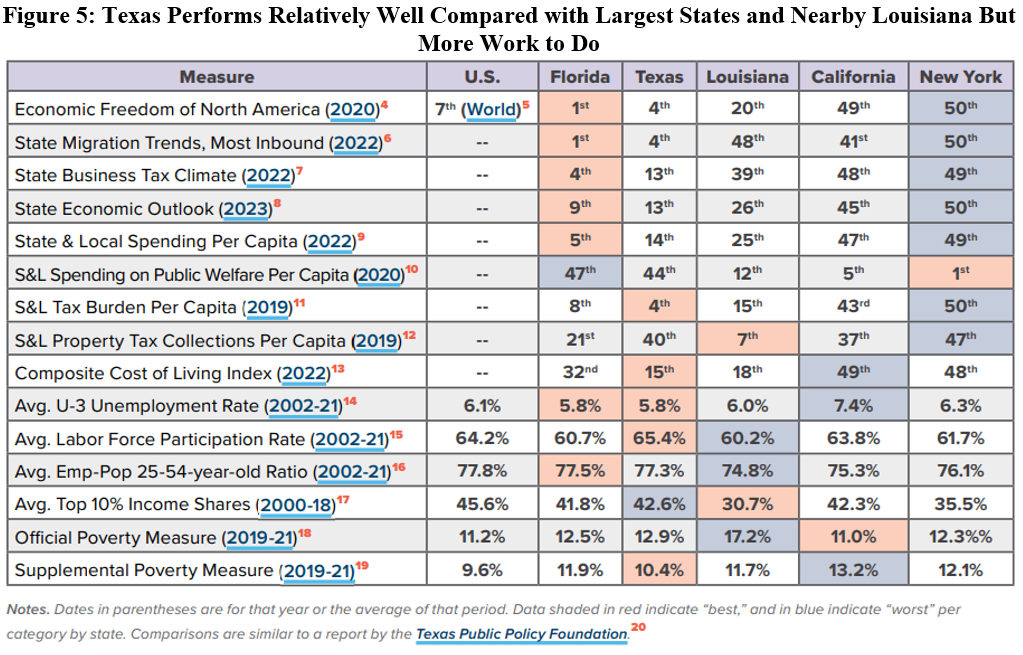 Free-Market Solutions: In 2023, the Texas Legislature should improve the Texas Model by:
Key Point: Inflation-adjusted average weekly earnings year-over-year are down for 24 consecutive months and economic growth is anemic creating a stagflationary period at best or recessionary period at worst. The best way to let people prosper is free-market capitalism. 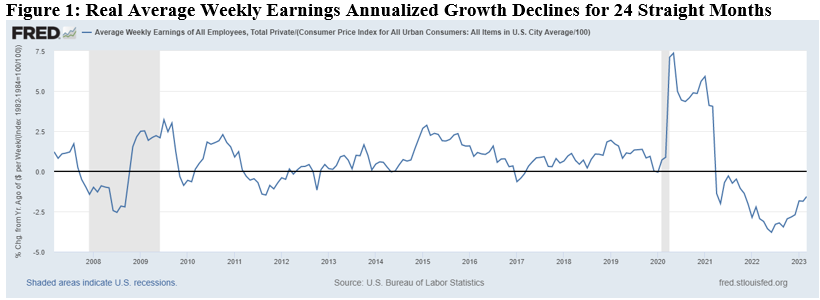 Overview: Government failures drove the “shutdown recession” and stagflationary period over the last three years that has plagued Americans, with more banking problems to come. This is fueled by the debt ceiling fight and likely elevate inflation for longer than many expected, with the only answers being less spending by Congress, less regulation by Biden administration, and less money printing by the Fed. The solution to these problems are pro-growth policies of shrinking government back to its constitutional roles. Labor Market: The Bureau of Labor Statistic recently released its U.S. jobs report for March 2023. The reports continue to be mixed with signs of strength though underlying weaknesses remain. The establishment survey shows there were +236,000 (+2.7%) net nonfarm jobs added in March to 155.6 million employees, which has increased by +4.1 million over the last year but just +3.2 million since February 2020 before the shutdowns. Over the last month, there were +189,000 jobs (+2.8%) added in the private sector and +47,000 jobs (+2.2%) added in the government sector. Most of the private sector jobs were added in the sectors of leisure (+72,000), private education and health services (+65,000), and professional and business services (+39,000), which the first two led over the last 12 months; retail trade (-14,600), construction (-9,000), manufacturing (-1,000), and financial activities (-1,000) had losses. Only retail trade (-15,200) declined over the last year. The household survey had another increase of +577,000 jobs to 160.9 million employed in March, which there have been declines in net employment in four of the last 12 months for a total increase of +2.6 million since March 2022 and +2.1 million since February 2020. The official U3 unemployment rate ticked down to 3.5% and the broader U6 underutilization rate fell to 6.7%. Since February 2020, the prime-age (25-54 years old) employment-population ratio is up by 0.2pp to 80.7%, prime-age labor force participation rate was 0.1-percentage point higher at 83.1%, and the total labor-force participation rate was 0.7-percentage-point lower at 62.6% with millions of people out of the labor force holding the U3 rate artificially low. Given some improvements, challenges remain for Americans as inflation-adjusted average weekly earnings were down -1.6% over the last year for the 24th straight month. Economic Growth: The U.S. Bureau of Economic Analysis’ recently released the 1st estimate for economic output for Q1:2023. Table 1 provides data over time for real total gross domestic product (GDP), measured in chained 2012 dollars, and real private GDP, which excludes government consumption expenditures and gross investment. Most of the estimates for Q4:2022 and growth in 2022 have been revised lower, providing more evidence that 2022 was a very weak economy if not a recession. 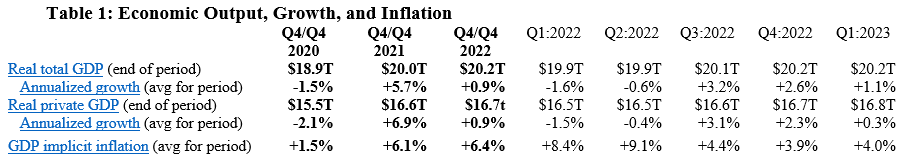 Economic activity has had booms and busts because of inappropriately imposed government COVID-related restrictions in response to the pandemic and poor fiscal and monetary policies that severely hurt people’s ability to exchange and work. In 2022, the first two quarters had declines in real total (and private) GDP, providing a reason to date recessions every time since at least 1950. While the second half of 2022 looked better, those two quarters were influenced by net exports and inventories that would have made the economy much weaker. For 2022, real total GDP growth is reported +2.1% year-over-year but measured by Q4-over-Q4 the growth rate was only +0.9%, which was the slowest Q4-over-Q4 growth during a recover on record. Then the anemic growth in Q1:2023 provides more reason that this is an extended recession or at least stagflation. The Atlanta Fed’s early GDPNow projection on April 28, 2023 for real total GDP growth in Q2:2023 was +1.7% based on the latest data available. If you consider the last expansion from June 2009 to February 2020, there was slower real private GDP growth in the latter period due to higher deficit-spending, contributing to crowding-out of the productive private sector. Congress’ excessive spending since February 2020 led to a massive increase in the national debt by nearly +$7.8 trillion that would have led to higher market interest rates. This is yet another example of how there is always an excessive government spending problem as noted in Figure 2 with federal spending and tax receipts as a share of GDP no matter if there are higher or lower tax rates. 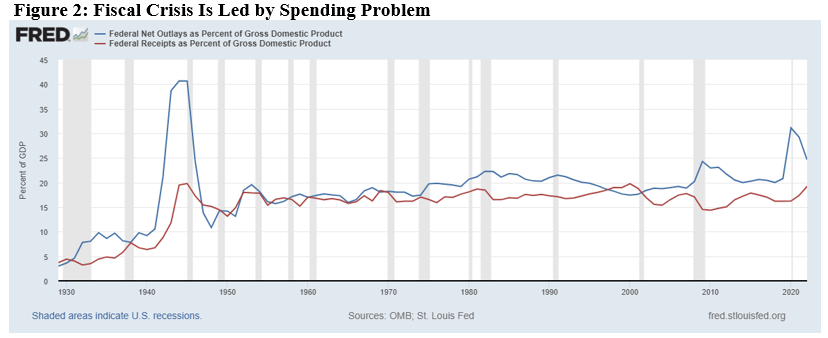 But the Fed monetized much of the new debt to keep interest rates artificially lower thereby creating higher inflation as there has been too much money chasing too few goods and services as production has been overregulated and overtaxed and workers have been given too many handouts. The Fed’s balance sheet exploded from about $4 trillion, when it was already bloated after the Great Recession, to nearly $9 trillion and is down only about 3.5% since the record high in April 2022 after rising nearly $400 billion in March then down $180 billion in April 2023. The Fed will need to cut its balance sheet (total assets over time) more aggressively if it is to stop manipulating markets (see this for types of assets on its balance sheet) and persistently tame inflation, as may need deflation given the rampant inflation over the last two years. The resulting annual inflation measured by the consumer price index (CPI) has cooled some from the peak of +9.1% in June 2022 but remains at +5.0% in March 2023, which remains the highest since 2008 as do other key measures of inflation. After adjusting total earnings in the private sector for CPI inflation, real total earnings are up by only +2.3% since February 2020 as the shutdown recession took a huge hit on total earnings and then higher inflation hindered increased purchasing power. Just as inflation is always and everywhere a monetary phenomenon, deficits and taxes are always and everywhere a spending problem. David Boaz at Cato Institute notes how this problem is from both Republicans and Democrats. In order to get control of this fiscal crisis which is contributing to a monetary crisis, the U.S. needs a fiscal rule like the Responsible American Budget (RAB) with a maximum spending limit based on the rate of population growth plus inflation. If Congress had followed this approach from 2003 to 2022, the figure below shows tax receipts, spending, and spending adjusted for only population growth plus chained-CPI inflation. Instead of an (updated) $19.0 trillion national debt increase, there could have been only a $500 billion debt increase for a $18.5 trillion swing in a positive direction that would have substantially reduced the cost of this debt to Americans. The Republican Study Committee recently noted the strength of this type of fiscal rule in its FY 2023 “Blueprint to Save America.” And to top this off, the Federal Reserve should follow a monetary rule so that the costly discretion stops creating booms and busts. 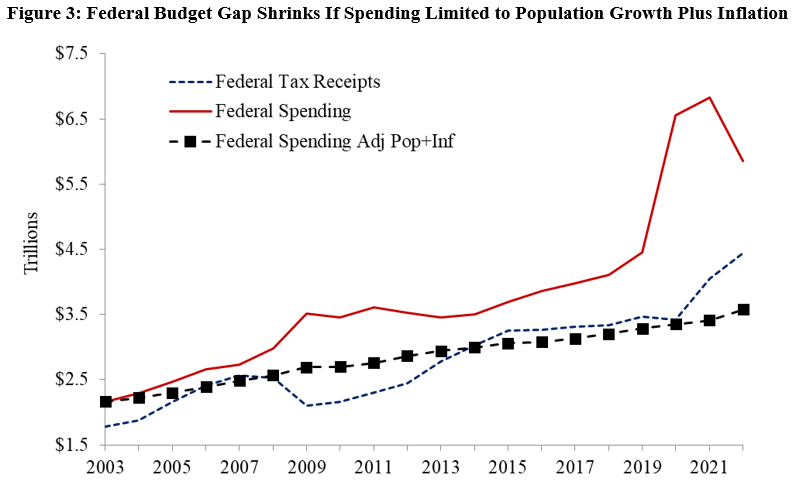 Bottom Line: I expect stagflation will continue along with the a deeper recession this year given the “zombie economy” and the unraveling of the banking sector which will hit main street hard. Instead of passing massive spending bills, the path forward should include pro-growth policies that shrink government rather than big-government, progressive policies. It’s time for limited government with sound fiscal and monetary policy that provides more opportunities for people to work and have more paths out of poverty. There is some optimism with the House Republicans debt ceiling bill package but it’s got an uphill battle to become law with Democrats in the Senate and White House so more must be done.
Recommendations: · Set a pro-growth policy path with less spending, regulating, and taxing at all levels of government. · Reject new spending packages that America cannot afford nor needs; pass the RAB instead. · Impose strict monetary rule with the Fed having a much smaller balance sheet and a much higher federal funds rate target until we End the Fed. · Enact return-to-work policies. Key Point: Louisiana’s economy has many weaknesses primarily because of poor policies hindering prosperity across the state, which is why there’s a need for the Pelican Institute’s “Comeback Agenda.” Louisiana’s Labor Market: Table 1 shows Louisiana’s labor market over time until the latest data for March 2023 from the U.S. Bureau of Labor Statistics. 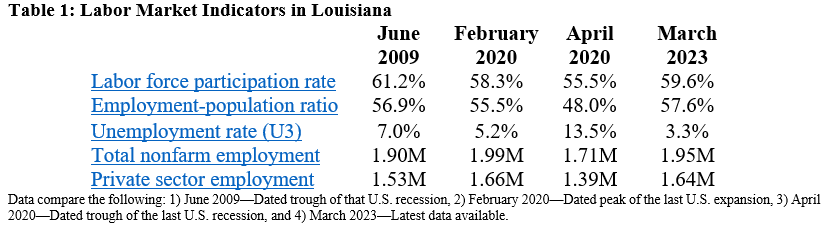 The establishment survey shows that net total nonfarm jobs in the state increased by 4,400 jobs last month (+0.2%), bringing total jobs to 42,700 jobs below the pre-shutdown level in February 2020. Private sector employment was up by 4,800 jobs (+0.3%) and government employment declined by 400 jobs (-0.1%) last month. Compared with a year ago, total employment was up by 40,200 jobs (+2.1%), with the private sector adding 31,700 jobs (+2.0%) and the government adding 4,100 jobs (+1.3%). The household survey finds that the working-age population declined by another 1,045 people (-0.03%) last month, down 11,789 people (-0.3%) over the last year, and down 32,292 people (-0.9%) since February 2020. But the civilian labor force rose by 15,246 people (+0.7%) last month, 23,150 people (+1.1%) over last year, and 42,381 people (+2.0%) since February 2020. These figures result in a labor force participation rate of 59.6%, which is up from 58.3% since pre-shutdown but well below the 61.2% rate in June 2009 at the trough of the Great Recession. While the unemployment rate of 3.3% is substantially lower than the 5.2% rate in February 2020, a broader look at Louisiana’s labor market shows that Louisianans still face challenges (see Figure 1), as the population continues to decline and comparatively with neighboring states based on several measures.  Economic Growth: The U.S. Bureau of Economic Analysis (BEA) recently provided the real (inflation-adjusted) gross domestic product (GDP) in Q4:202 for Louisiana and other states in Figure 2. 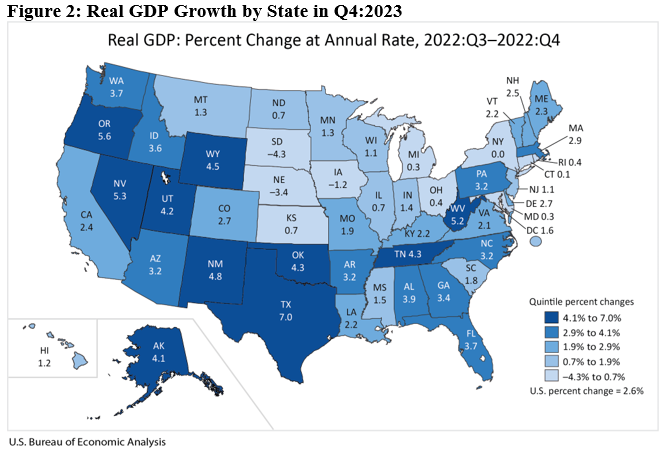 Table 2 shows how U.S. and Louisiana economies performed since 2020. The steep declines were during the shutdowns in 2020 in response to the COVID-19 pandemic, which was when the labor market suffered most. The increase in real GDP of +2.2% in Q4:2022 ranked 26th in the country, resulting in an annual decline in economic output by -1.8% in 2022 which was the second worst in the country. 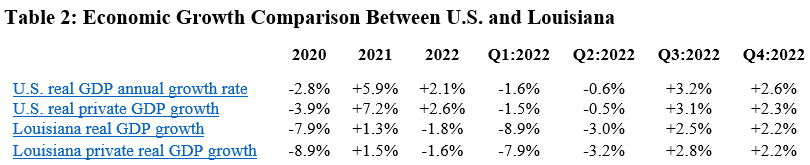 The BEA also reported that personal income in Louisiana grew at an annualized pace of +6.0% (ranked 32nd) in Q4:2022 (below +7.4% U.S. average). This resulted in personal income growth of 0.0% in 2022, ranking 50th of the states. Personal income per person in Louisiana increased by 0.8% to $54,622 last year, which ranked 42nd in the country and the increase was well below inflation. Bottom Line: Louisianans gained jobs in March, but those jobs are not paying enough to beat inflation or help expand investment in stagnant economy, resulting in costly stagflationary situation. Institutions matter to human flourishing, but they are too weak in Louisiana according to the Fraser Institute’s ranking of 20th for economic freedom and other measures. The state has improved its tax code recently and lower taxes may happen soon, but there’s a once-in-a-generation opportunity to ensure prosperity. The combination of spending restraint, not busting the spending caps, paying down debt, and putting money in the rainy day fund for future tax reforms and to hit the triggers for tax relief now are essential. These steps would help improve the state’s poor business tax climate, help curb the net outmigration of Louisianans, and help mitigate the 19.6% poverty rate that ranks second highest in the country. Which pro-growth policies be pursued? Refer to the Pelican Institute’s “Comeback Agenda” for policy recommendations related to the state’s budget and taxes, K-12 education, public safety, social safety nets and workforce development, technology and innovation, and reducing regulatory barriers. Key Point: Texas continues to be a leader in job creation over the last year (chart below by @SoquelCreek) and set employment records across the state, but Texans who are struggling from an affordability crisis would benefit from less spending, regulating, and taxing. 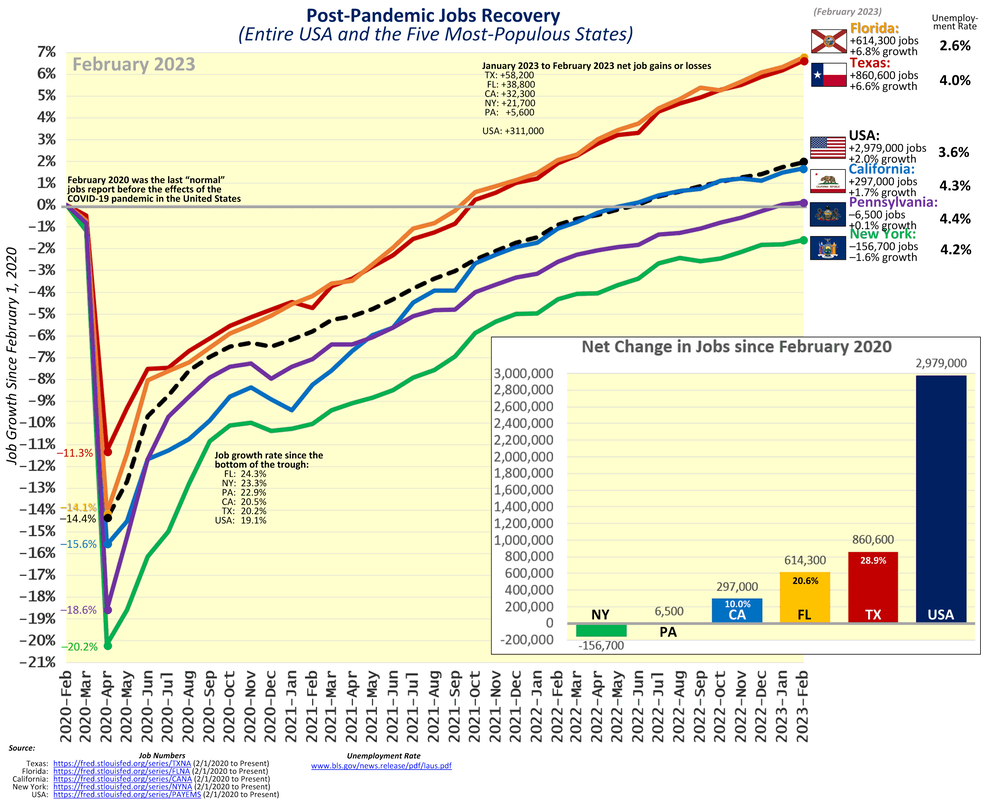 Overview: Texas has been a national leader in the economic recovery since the inappropriate shutdown recession in Spring 2020. This includes reaching a new record high in total nonfarm employment for the 17th straight month, leading exports of technology products for 21 consecutive years, and being home to the most Fortune 500 companies in the country with more than 50. While the 87th Texas Legislature passed a Conservative Texas Budget and passed country’s strongest state spending limit, the current 88th Texas Legislature has more to do to freeze spending and use more than $60 billion in excess taxes collected to put school district maintenance and operations on a path to elimination so Texans can stop renting and start owning their property. 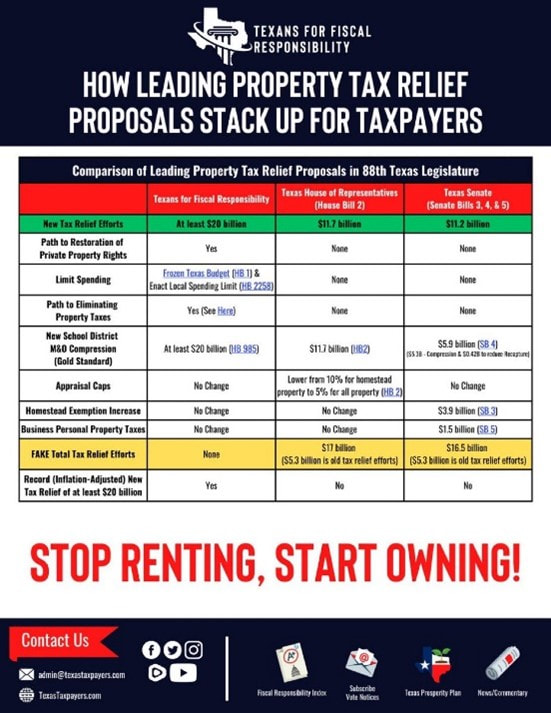 Labor Market: The best path to prosperity is a job, as it helps bring financial self-sufficiency, dignity, hope, and purpose to people so they can earn a living, gain skills, and build social capital. The table below shows Texas’ labor market for February 2023. 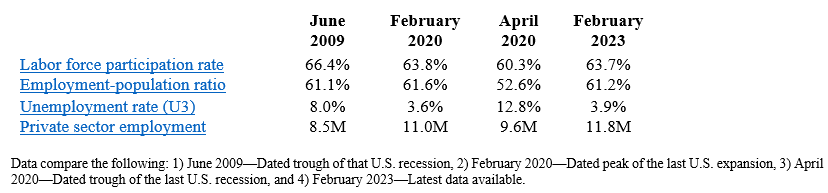 The establishment survey shows that net nonfarm jobs in Texas increased by 58,200 last month, resulting in increases for 33 of the last 34 months, to bring record-high employment to 13.8 million. Compared with a year ago, total employment was up by 611,400 (+4.6%)—second fastest growth rate in the country to Nevada—with the private sector adding 560,100 jobs (+5.0) and the government adding 51,300 jobs (+2.6%). 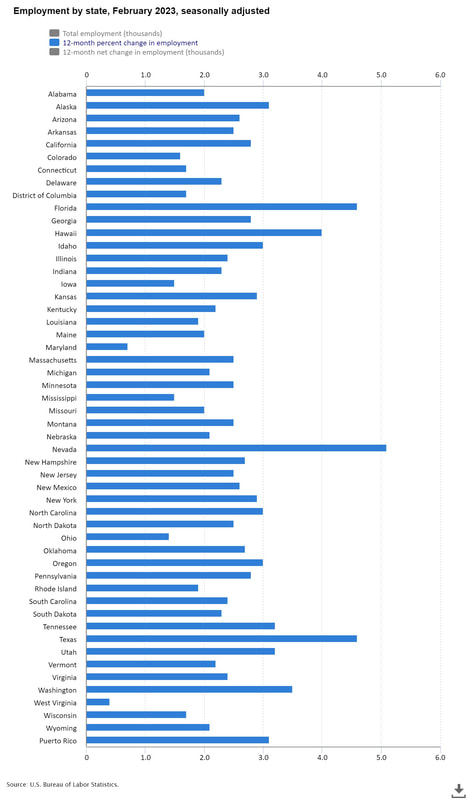 The household survey shows that the labor force participation rate and employment-population rate are slightly lower than in February 2020, but the former is well below June 2009 at the trough of the Great Recession. The private sector now employs 800,000 more people than pre-pandemic. Texans face challenges with a worse unemployment rate, though historically low but higher than U.S. rate of 3.6% though many have dropped out of the labor force elsewhere. Economic Growth: The U.S. Bureau of Economic Analysis (BEA) reported the real gross domestic product (GDP) by state for Q3:2022. The figure below shows Texas had the second fastest GDP growth (first is Alaska) of +8.2% on an annualized basis to $1.89 trillion (above the U.S. average of +3.2% to $20.05 trillion). In the prior quarter, Texas had the fastest growth with +1.8% growth as the U.S. average declined by -0.6% that quarter. Of course, these followed Texas’ GDP contractions of -7.0% in Q1:2020 and -28.5% in Q2 during the depths of the shutdown recession. Fortunately, GDP rebounded in Q3 and Q4, yet declined overall in 2020 by -2.9% (less than -3.4% decline of U.S. average) but increased by +3.9% in 2021 (below the +5.9% U.S. average). The BEA also reported that personal income in Texas grew at an annualized pace of +6.9% in Q3:2022 (ranked 6th highest and faster than the U.S. average of +5.3%) but slower than the robust +8.4% in Q2:2022 (ranked 6th best and above the U.S. average of +4.9%) as job creation and inflated income measures found their way across the economy. 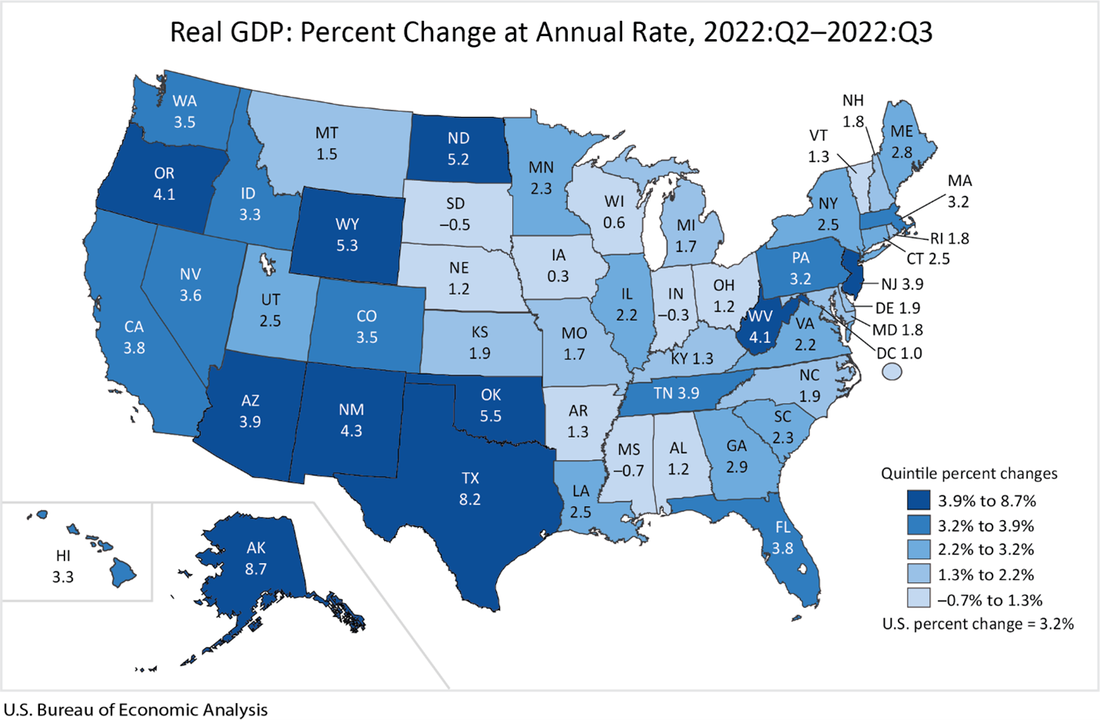 Bottom Line: As Texans face an affordability crisis from high inflation and high property taxes and an uncertain future with the U.S. economy likely in a recession, they need substantial relief to help make ends meet. Other states are cutting, flattening, and phasing out taxes, so Texas must make bold reforms to support more opportunities to let people prosper, mitigate the affordability crisis, and withstand destructive policies out of D.C.
Free-Market Solutions: In 2023, the Texas Legislature should improve the Texas Model by:
Key Point: Average weekly earnings adjusted for inflation are now down for 23 straight months year-over-year as inflation keeps roaring. But there’s hope if we give free-market capitalism a chance to let people prosper. 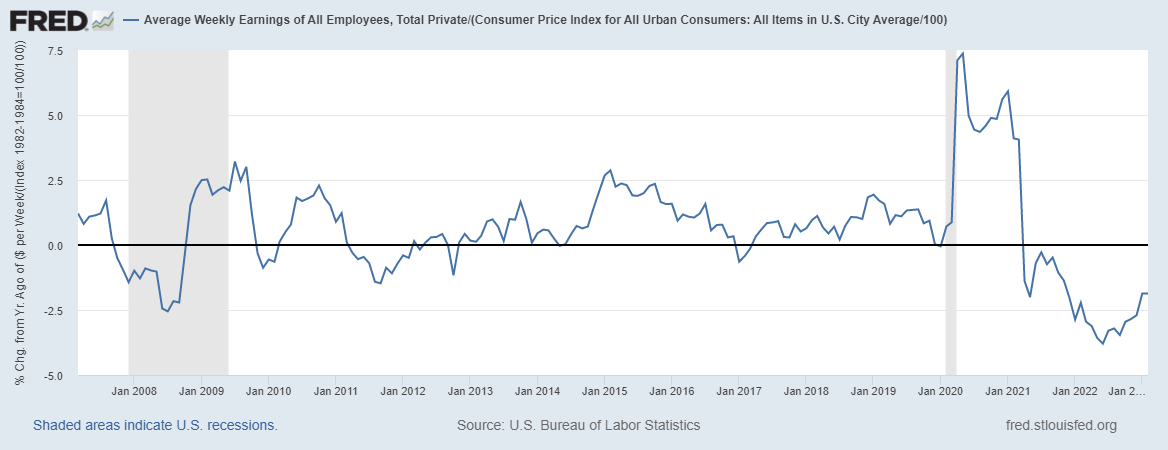 Overview: The government failures that drove the “shutdown recession,” high inflation, and weak economic growth over the last three years continue to plague Americans. This includes excessive federal spending leading to massive cumulative deficit spending of $7.6 trillion since January 2020 to reach $31.6 trillion in national debt—about $250,000 owed per taxpayer. This has created a fight between the Biden administration and House Republicans over the debt ceiling, as raising it must come with spending restraint. And more inflation is on the horizon as the Federal Reserve recently increased its balance sheet and the government creates rampant moral hazard by insuring what appears to be all deposits at big banks. The solution to these problems are pro-growth policies of shrinking government back to its constitutional roles. Labor Market: The Bureau of Labor Statistic recently released its U.S. jobs report for February 2023. After substantial revisions in the previous report which likely indicate bias in these data for a while, there were some signs of strength while others suggest weakness. The establishment survey shows there were +311,000 (+2.9%) net nonfarm jobs added in February to 155.4 million employees, with +265,000 (+3.0%) added in the private sector and +46,000 (+1.9%) jobs added in the government sector. Most of the private sector jobs were added in the sectors of leisure and hospitality (+105,000), private education and health services (+74,000), and retail trade (+50,100), which the first two sectors also led over the last 12 months; information (-25,000), manufacturing (-4,000), utilities (-1,100), and financial activities (-1,000) had net job declines last month and only retail trade (-2,300) declined over the last year. The household survey had another increase of +177,000 jobs to 160.3 million employed. There have been declines in net jobs in four of the last 11 months for a total increase of +2 million since March 2022, which is about half of the +3.9 million net jobs per the establishment survey. The official U3 unemployment rate rose to 3.6% and the broader U6 underutilization rate rose to 6.8%. Since February 2020 before the shutdown recession, the prime age (25-54 years old) employment-population ratio is flat at 80.5%, prime-age labor force participation rate was 0.1-percentage point higher at 83.1%, and the total labor-force participation rate was 0.8-percentage-point lower at 62.5%with millions of people out of the labor force thereby holding the U3 unemployment rate artificially low But challenges remain for Americans as inflation-adjusted average weekly earnings were down -1.9% over the last year for the 23rd straight month. Economic Growth: The U.S. Bureau of Economic Analysis’ recently released the 2nd estimate for economic output for Q4:2022. The following table provides data over time for real total gross domestic product (GDP), measured in chained 2012 dollars, and real private GDP, which excludes government consumption expenditures and gross investment. And most of the estimates for Q4:2022 and growth in 2022 were revised lower, providing more evidence that 2022 was a very weak year if not a recession. 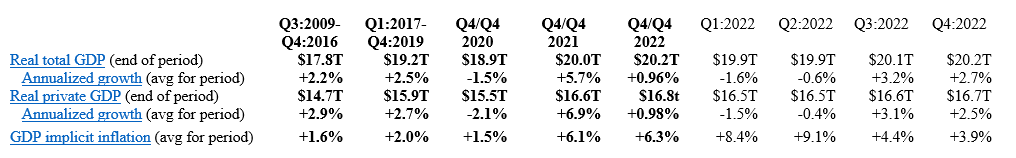 Economic activity has had booms and busts thereafter because of inappropriately imposed government COVID-related restrictions in response to the pandemic and poor fiscal policies that severely hurt people’s ability to exchange and work. Since 2021, the growth in nominal total GDP, measured in current dollars, was dominated by inflation, which distorts economic activity. The GDP implicit price deflator was +6.1% for Q4-over-Q4 2021, representing half of the +12.2% increase in nominal total GDP. This inflation measure was +9.1% in Q2:2022—the highest since Q1:1981—for a +8.5% increase in nominal total GDP that quarter. This made two consecutive declines in real total (and private) GDP, providing a criterion to date recessions every time since at least 1950. In Q3:2022, nominal total GDP was +7.6% and GDP inflation was +4.4% for the +3.2% increase in real total GDP. But if inflation had been as high as it was in the prior two quarters or had the contribution of net exports of goods and services (driven by natural gas exports to Europe) not been 2.9%, real total GDP would have either declined or been essentially flat for a third straight quarter. In Q4:2022, there was a similar story of weakness as nominal total GDP was +6.6% and GDP inflation was +3.9% for the +2.7% increase in real total GDP. But if you consider the +2.7% real total GDP growth was driven by contributions of volatile inventories (+1.5pp), government spending (+0.6pp), and next exports (+0.5pp) which total +2.6pp, the actual growth is quite tepid like it was in Q3:2022. For all of 2022, real total GDP growth is reported +2.1% year-over-year but measured by Q4-over-Q4 the growth rate was only +0.9%, which was the slowest Q4-over-Q4 growth for a year since 2009 (last part of Great Recession). The Atlanta Fed’s early GDPNow projection on March 24, 2023 for real total GDP growth in Q1:2023 was +3.2% based on the latest data available. The table above also shows the last expansion from June 2009 to February 2020. A reason for slower real private GDP growth in the latter period is due to higher deficit-spending, contributing to crowding-out of the productive private sector. Congress’ excessive spending thereafter led to a massive increase in the national debt by nearly +$7 trillion that would have led to higher market interest rates. This is yet another example of how there is always an excessive government spending problem as noted in the following figure with federal spending and tax receipts as a share of GDP no matter if there are higher or lower tax rates. 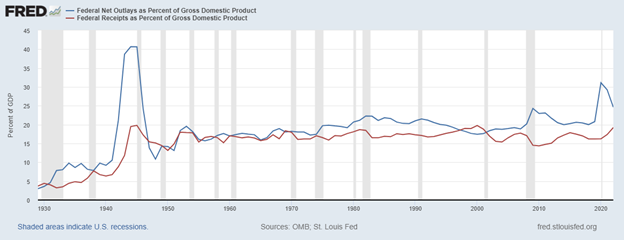 But the Fed monetized much of the new debt to keep rates artificially lower thereby creating higher inflation as there has been too much money chasing too few goods and services as production has been overregulated and overtaxed and workers have been given too many handouts. The Fed’s balance sheet exploded from about $4 trillion, when it was already bloated after the Great Recession, to nearly $9 trillion and is down only about 2.6% since the record high in April 2022 after rising nearly $400 billion in March 2023. The Fed will need to cut its balance sheet (total assets over time) more aggressively if it is to stop manipulating so many markets (see figure below with types of assets on its balance sheet) and persistently tame inflation, which there’s likely a need for deflation for a while given the rampant inflation over the last two years. 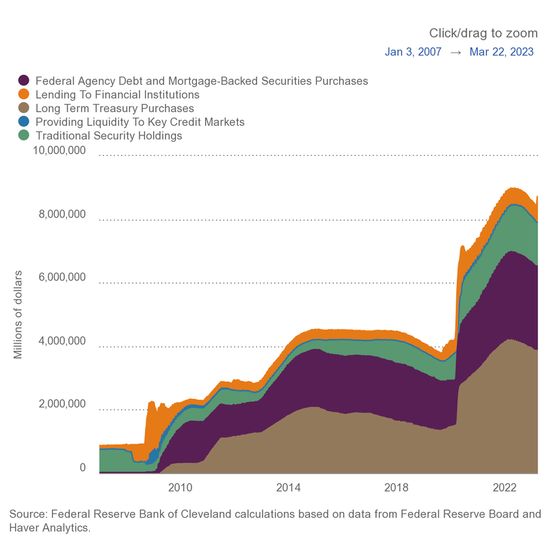 The resulting inflation measured by the consumer price index (CPI) has cooled some from the peak of +9.1% in June 2022 but remains hot at +6.0% in February 2023 over the last year, which remains near 40-year highs along with other key measures of inflation. After adjusting total earnings in the private sector for CPI inflation, real total earnings are up by only +2.2% since February 2020 as the shutdown recession took a huge hit on total earnings and then higher inflation hindered increased purchasing power. Just as inflation is always and everywhere a monetary phenomenon, deficits and taxes are always and everywhere a spending problem. The figure by David Boaz at Cato Institute shows how this problem is from both Republicans and Democrats. As the federal debt far exceeds U.S. GDP, America needs a fiscal rule like the Responsible American Budget (RAB) with a maximum spending limit based on population growth plus inflation. If Congress had followed this approach from 2003 to 2022, the figure below shows tax receipts, spending, and spending adjusted for only population growth plus chained-CPI inflation. Instead of an (updated) $19.0 trillion national debt increase, there could have been only a $500 billion debt increase for a $18.5 trillion swing in a positive direction that would have substantially reduced the cost of this debt to Americans. The Republican Study Committee recently noted the strength of this type of fiscal rule in its FY 2023 “Blueprint to Save America.” And to top this off, the Federal Reserve should follow a monetary rule so that the costly discretion stops creating booms and busts. 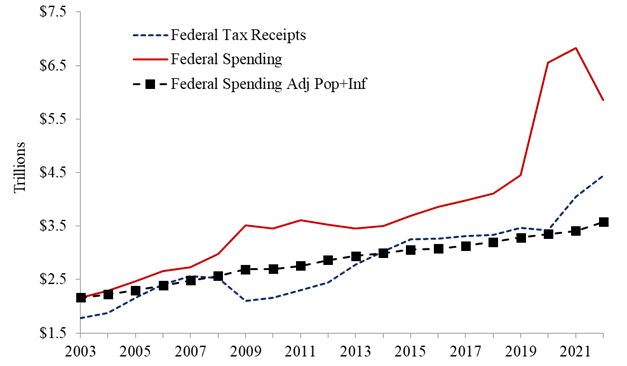 Bottom Line: My expectation is that stagflation will continue along with the a deeper recession this year given the “zombie economy” and the unraveling of the banking sector which will hit main street. Instead of passing massive spending bills, the path forward should include pro-growth policies that get government out of the way rather than the progressive policies of more spending, regulating, and taxing. The time is now for limited government with sound fiscal and monetary policy that provides more opportunities for people to work and have more paths out of poverty.
Recommendations:
Key Point: Louisiana’s labor market looks okay on the surface, but weaknesses remain because of poor policies which hinder economic opportunity across the state. There’s need for a comeback agenda. Louisiana’s Labor Market: The table below shows Louisiana’s labor market over time until the latest data for February 2023 from the U.S. Bureau of Labor Statistics. 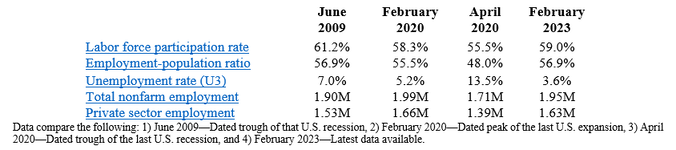 The establishment survey shows that net total nonfarm jobs in the state increased by 2,400 jobs last month (+0.1%), bringing total jobs to 46,600 jobs below the pre-shutdown level in February 2020. Private sector employment was up by 2,500 jobs (+0.2%) and government employment declined by 100 jobs (-0.1%) last month. Compared with a year ago, total employment was up by 35,500 jobs (+1.9%), which was the 7th lowest rate in the country, with the private sector adding 31,700 jobs (+2.0%) and the government adding 3,800 jobs (+1.2%). The household survey finds that the working-age population declined by 1,181 people (-0.03%) last month, down 12,944 people (-0.4%) over the last year, and down 31,247 people (-0.9%) since February 2020. But the civilian labor force rose by 8,240 people (+0.4%) last month, 4,312 people (+0.2%) over last year, and 9,465 people (+0.5%) since February 2020. These figures result in a labor force participation rate of 59.0% which is up from 58.3% since pre-shutdown but well below the 61.2% rate in June 2009 at the trough of the Great Recession. While the unemployment rate of 3.6% is substantially lower than the 5.2% rate in February 2020, a broader look at Louisiana’s labor market shows that Louisianans still face challenges, especially compared with neighboring states based on several measures. 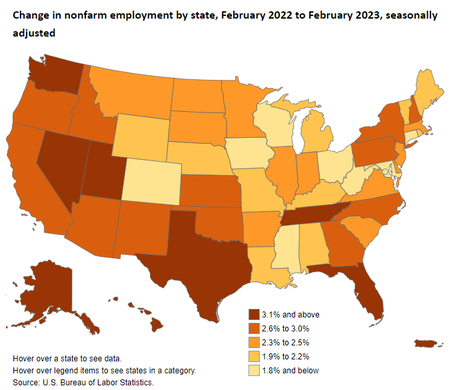 Economic Growth: The U.S. Bureau of Economic Analysis (BEA) recently provided the real (inflation-adjusted) gross domestic product (GDP) in Q3:2022 for Louisiana and other states.  The following table shows how U.S. and Louisiana economies performed since 2020. The steep declines were during the shutdowns in 2020 in response to the COVID-19 pandemic, which was when the labor market suffered most. The decline in real GDP annualized growth of -3% in Q2:2022 was the 5th worst and increase of +2.5% in Q3:2022 ranked 23rd in the country. 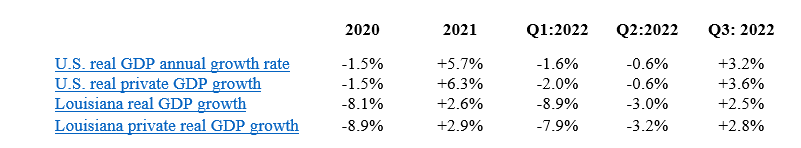 The BEA also reported that personal income in Louisiana grew at an annualized pace of +5.8% (ranked 19th) in Q2:2022 (tied +5.8% U.S. average) and of +2.5% (ranked 47th) in Q3:2022 (below +5.3% U.S. average). Bottom Line: Louisianans gained jobs in February but continue to feel the costs of restrictive policies that reduce opportunities for them to find well-paid jobs. Institutions matter to human flourishing but they are too weak in Louisiana according to the Fraser Institute’s ranking of 20th for economic freedom. And the Tax Foundation recently ranked the Pelican State as having the 12th worst business tax climate and 15th highest corporate income tax rate. The state has improved its tax code recently and lower taxes may happen soon, but excessive government spending, highly complicated personal income tax code, and poor business tax climate contribute to a net outmigration of Louisianans and a 19.6% poverty rate that ranks highest in the country. State and local policymakers should work to reverse this trend by passing pro-growth policies. 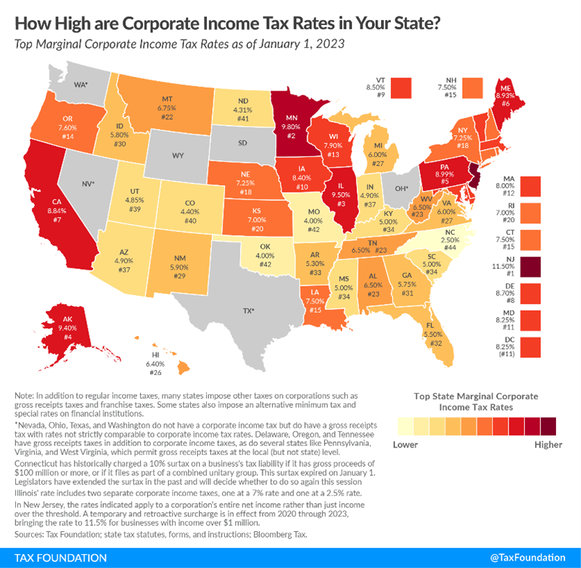 Comeback Agenda: The Pelican Institute for Public Policy recently released “Louisiana’s Comeback Agenda” to turn things around in the Pelican State by doing the following:
Key Point: The U.S. economy in 2022 had the slowest Q4-over-Q4 growth during a recovery since at least 2009 and average weekly earnings are now down for 22 straight months as inflation keeps roaring. But there’s hope if we just give free-market capitalism a chance to let people prosper. 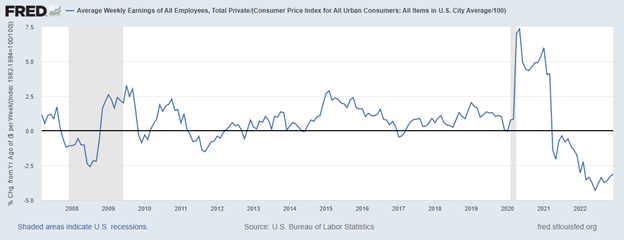 Overview: Although President Biden recently tried to claim that the state of the union is strong, facts tell a different story. The government failures that drove the “shutdown recession,” high inflation, and weak economic growth over the last three years continue to plague Americans. This includes excessive federal spending leading to massive deficit spending adding up to $7 trillion since January 2020 to reach nearly $31.5 trillion in national debt—about $250,000 owed per taxpayer. This has created a fight between the Biden administration and House Republicans over the debt ceiling, as raising it must come with spending restraint to avoid some of the fiscal insanity that will lead to insolvency if nothing is changed. And more inflation could be on the horizon if the Federal Reserve chooses to monetize more more of the new debt, which past excess has already contributed to 40-year-high inflation rates. These government failures with little relief from pro-growth policies in sight mean that things will get worse before they get better.  Labor Market: The Bureau of Labor Statistic recently released its U.S. jobs report for January 2022. This report came with substantial revisions to seasonal adjustments and population estimates which could bias the data for a while given that the revised estimates include the much of the last three years of data that are highly volatile. And recall the recent report by the Philadelphia Fed finds that if you add up the jobs added in states in Q2:2022 there were just 10,500 net new jobs rather than more than 1 million reported. The establishment survey shows there were +517,000 (+3.3%) net nonfarm jobs added in January to 155.1 million employees, with +443,000 (+3.6%) added in the private sector and +74,000 (+1.4%) jobs added in the government sector. Most of the private sector jobs were added in the sectors of leisure and hospitality (+128,000), private education and health services (+105,000), and professional and business services (+82,000), which these three sectors led over the last 12 months as well; information (-5,000) and utilities (-700) were the only net job declines over the last month and no sector had net job losses over the last year. Average hourly earnings for all employees was up by 10 cents last month to $33.03, or up by +4.4% over the last year. And average weekly earnings in the private sector increased by $13.35 last month to $1,146, or up by +4.7% over the 12 months. The household survey had another large increase of +894,000 jobs added to 160.1 million employed There have been declines in net jobs in four of the last 10 months for a total increase of +1.8 million since March 2022, which is about half of the +3.6 million of the net jobs added per the establishment survey. The official U3 unemployment rate declined slightly to 3.4% which is the lowest since 1969. But challenges remains as inflation-adjusted average weekly earnings were down -1.5% over the last year for the 22nd straight month, weighing on Americans budgets to make ends meet. And since February 2020 before the shutdown recession, the prime age (25-54 years old) employment-population ratio was 0.3-percentage point lower, prime-age labor force participation rate was 0.3-percentage point lower, and the total labor-force participation rate was 0.9-percentage-point lower with millions of people out of the labor force thereby holding the U3 unemployment rate much lower than otherwise. 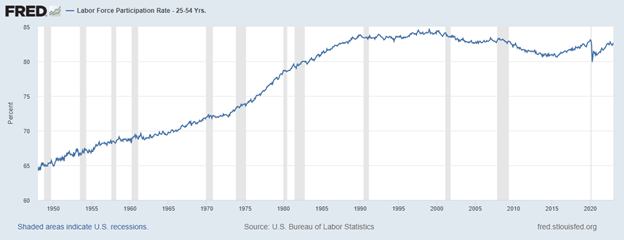 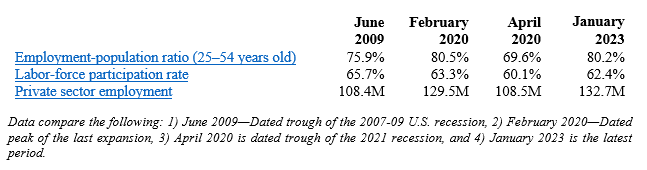 Economic Growth: The U.S. Bureau of Economic Analysis’ recently released the 2nd estimate for economic output for Q4:2022. The following table provides data over time for real total gross domestic product (GDP), measured in chained 2012 dollars, and real private GDP, which excludes government consumption expenditures and gross investment. And most of the estimates for Q4:2022 and growth in 2022 were revised lower, providing more evidence that 2022 was a very weak year if not a recession. 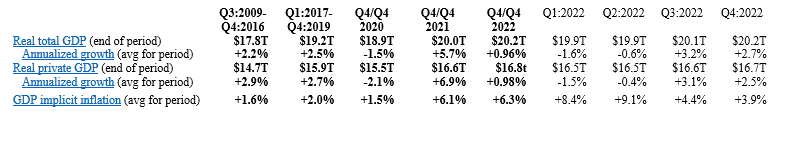 The shutdown recession in 2020 had GDP contract at historic annualized rates because of individual responses and government-imposed shutdowns related to the COVID-19 pandemic. Economic activity has had booms and busts thereafter because of inappropriately imposed government COVID-related restrictions in response to the pandemic and poor fiscal policies that severely hurt people’s ability to exchange and work. Since 2021, the growth in nominal total GDP, measured in current dollars, was dominated by inflation, which distorts economic activity. The GDP implicit price deflator was +6.1% for Q4-over-Q4 2021, representing half of the +12.2% increase in nominal total GDP. This inflation measure was +9.1% in Q2:2022—the highest since Q1:1981—for a +8.5% increase in nominal total GDP that quarter. This made two consecutive declines in real total (and private) GDP, providing a criterion to date recessions every time since at least 1950. In Q3:2022, nominal total GDP was +7.6% and GDP inflation was +4.4% for the +3.2% increase in real total GDP. But if inflation had been as high as it was in the prior two quarters or had the contribution of net exports of goods and services (driven by natural gas exports to Europe) not been 2.9%, real total GDP would have either declined or been essentially flat for a third straight quarter. In Q4:2022, there was a similar story of weakness as nominal total GDP was +6.6% and GDP inflation was +3.9% for the +2.7% increase in real total GDP. But if you consider the +2.7% real total GDP growth was driven by contributions of volatile inventories (+1.5pp), government spending (+0.6pp), and next exports (+0.5pp) which total +2.6pp, the actual growth is quite tepid like it was in Q3:2022. For all of 2022, real total GDP growth is reported +2.1% year-over-year but measured by Q4-over-Q4 the growth rate was only +0.9%, which was the slowest Q4-over-Q4 growth for a year since 2009 (last part of Great Recession). The Atlanta Fed’s early GDPNow projection on February 24, 2023 for real total GDP growth in Q1:2023 was +2.7% based on the latest data available. The table above also shows the last expansion from June 2009 to February 2020. A reason for slower real private GDP growth in the latter period is due to higher deficit-spending, contributing to crowding-out of the productive private sector. Congress’ excessive spending thereafter led to a massive increase in the national debt by more than +$7 trillion that would have led to higher market interest rates. This is yet another example of how there is always an excessive government spending problem as noted in the following figure with federal spending and tax receipts as a share of GDP no matter if there are higher or lower tax rates.  But the Fed monetized much of the new debt to keep rates artificially lower thereby creating higher inflation as there has been too much money chasing too few goods and services as production has been overregulated and overtaxed and workers have been given too many handouts. The Fed’s balance sheet exploded from about $4 trillion, when it was already bloated after the Great Recession, to nearly $9 trillion and is down only about 6.5% since the record high in April 2022. The Fed will need to cut its balance sheet (see first figure below with total assets over time) more aggressively if it is to stop manipulating so many markets (see second figure with types of assets on its balance sheet) and persistently tame inflation, which there’s likely a need for deflation for a while given the rampant inflation over the last two years. 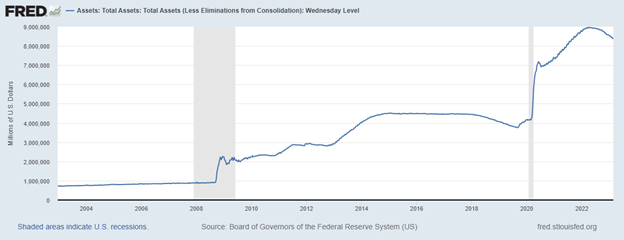 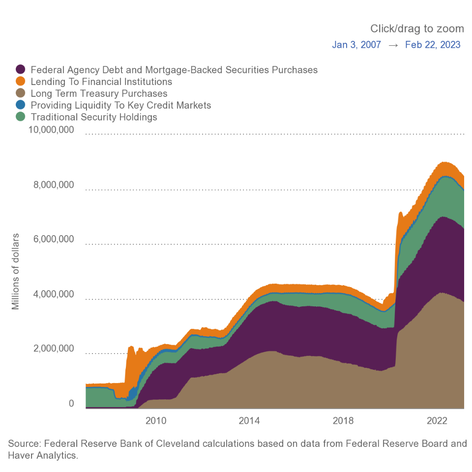 The resulting inflation measured by the consumer price index (CPI) has cooled some from the peak of +9.1% in June 2022 but remains hot at +6.4% in January 2023 over the last year, which remains at a 40-year high (highest since July 1982) along with other key measures of inflation (see figure below). After adjusting total earnings in the private sector for CPI inflation, real total earnings are up by only +2.2% since February 2020 as the shutdown recession took a huge hit on total earnings and then higher inflation hindered increased purchasing power. 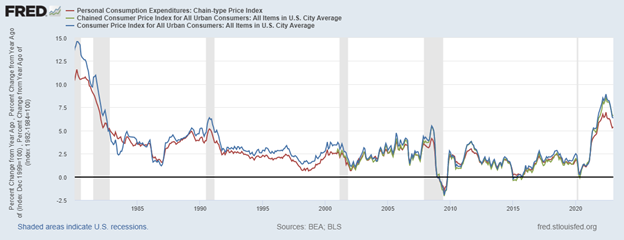 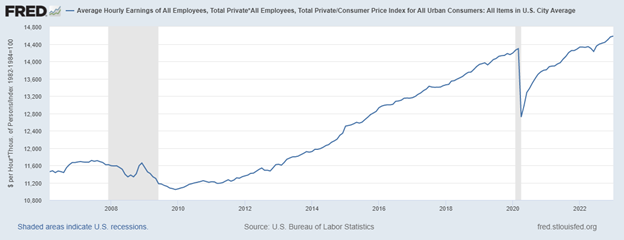 Just as inflation is always and everywhere a monetary phenomenon, deficits and taxes are always and everywhere a spending problem. The figure below (h/t David Boaz at Cato Institute) shows how this problem is from both Republicans and Democrats. 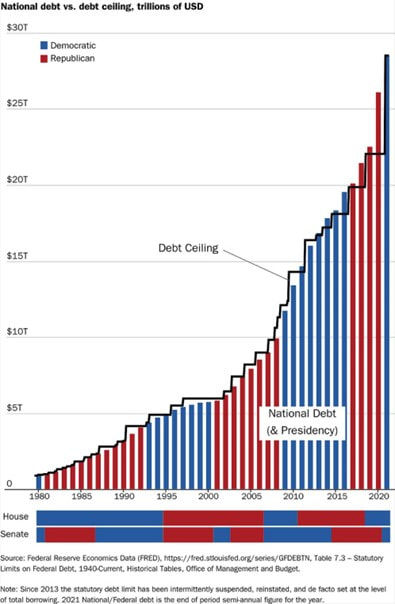 As the federal debt far exceeds U.S. GDP, and President Biden proposed an irresponsible FY23 budget and Congress never passed one until the ridiculous $1.7 trillion omnibus in December, America needs a fiscal rule like the Responsible American Budget (RAB) with a maximum spending limit based on population growth plus inflation. If Congress had followed this approach from 2003 to 2022, the figure below shows tax receipts, spending, and spending adjusted for only population growth plus chained-CPI inflation. Instead of an (updated) $19.0 trillion national debt increase, there could have been only a $500 billion debt increase for a $18.5 trillion swing in a positive direction that would have substantially reduced the cost of this debt to Americans. Of course, part of this includes the Great Recession and the Shutdown Recession, so these periods would have likely been good reason to exceed the limit, but regardless we would be in a much better fiscal and economic situation with this fiscal rule. The Republican Study Committee recently noted the strength of this type of fiscal rule in its FY 2023 “Blueprint to Save America.” And to top this off, the Federal Reserve should follow a monetary rule so that the costly discretion stops creating booms and busts. 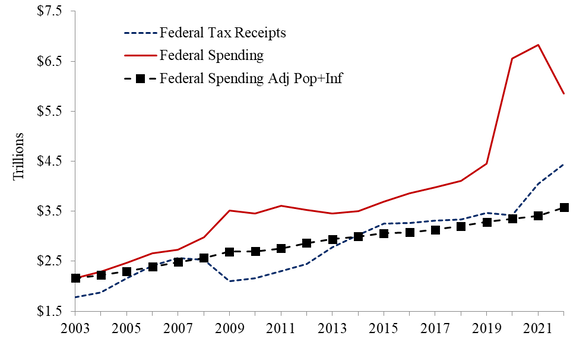 Bottom Line: While there appears to be a strengthening labor market in January, let’s see if this continues as my guess is that these were biased from the data adjustments, and we will see a weaker labor market in the months to come. My expectation is that stagflation will continue along with the a deeper recession this year given the “zombie economy” with “zombie labor” of many workers sitting on the sidelines and others are “quiet quitting” along with the failures of many “zombie firms” that live on debt. Ultimately, Americans are struggling from bad policies out of D.C.. Instead of passing massive spending bills, the path forward should include pro-growth policies. These policies ought to be similar to those that supported historic prosperity from 2017 to 2019 that get government out of the way rather than the progressive policies of more spending, regulating, and taxing. The time is now for limited government with sound fiscal and monetary policy that provides more opportunities for people to work and have more paths out of poverty.
Recommendations:
Key Point: Louisiana’s labor market looks okay even as the unemployment rate increased by 0.2-percentage point to 3.5% unemployment rate. But the labor force has 10,622 (-0.5%) fewer people in it than pre-shutdown in February 2020 and private sector employment is 30,000 (-1.8%) below then, indicating a much weaker labor market and economy overall. 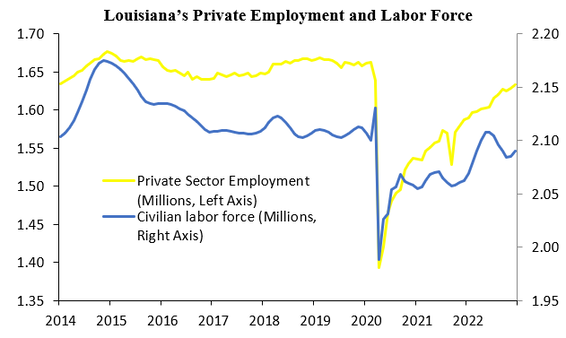 Labor Market: A job is the best path to prosperity as work brings dignity, hope, and purpose to people through life-long benefits of earning a living, gaining skills, and building social capital. The table below shows Louisiana’s labor market over time until the latest data for December 2022 by the U.S. Bureau of Labor Statistics. 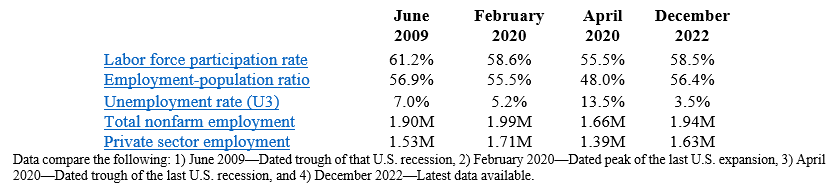 The establishment survey shows that net total nonfarm jobs in the state increased by 4,800 jobs last month (+0.2%), bringing this to 50,700 jobs below the pre-shutdown level in February 2020. Private sector employment was up by 4,400 jobs (+0.3%) and government employment rose by 400 jobs (+0.1%) last month. Compared with a year ago, total employment was up by 46,200 jobs (+2.4%) with the private sector adding 45,600 jobs (+2.9%) and the government adding 600 jobs (+0.2%). The household survey finds that the civilian labor force rose by 5,028 people last month and is down 10,622 people since February 2020, which results in the labor force participation rate of 58.5% being 0.1-percentage point lower than it was in February 2020 but well below the 61.2% rate in June 2009 at the trough of the Great Recession. The employment-population ratio is 0.9-percentage point above where it was in February 2020 and nearly back to where it was in June 2009. While the unemployment rate of 3.5% is substantially lower than the 5.2% rate in February 2020, a broader look at Louisiana’s labor market rather than this weak indicator shows that Louisianans still face challenges, especially compared with neighboring states based on several measures. 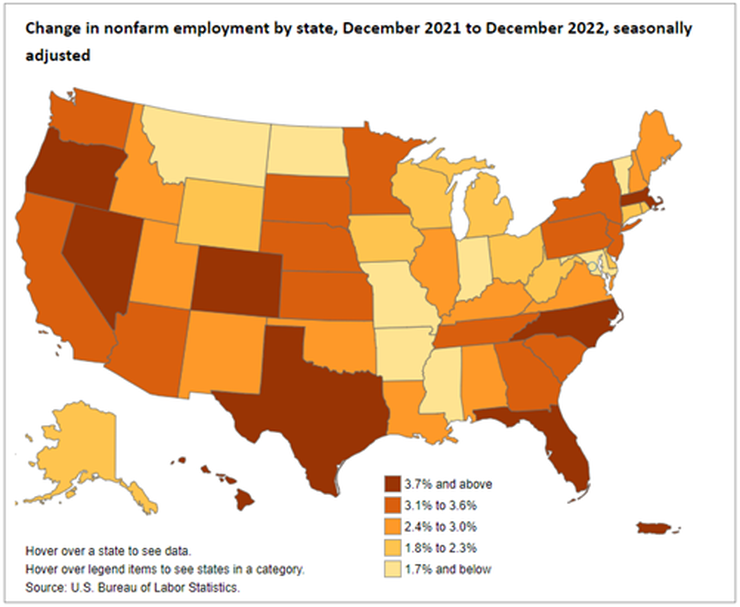 Economic Growth: The U.S. Bureau of Economic Analysis (BEA) recently provided the real (inflation-adjusted) gross domestic product (GDP) in Q3:2022 for Louisiana and other states. 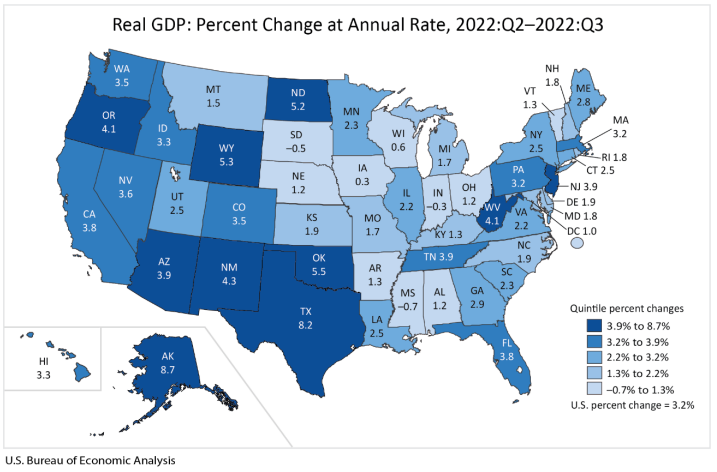 The following table shows how U.S. and Louisiana economies performed since 2020. The steep declines were during the shutdowns in 2020 in response to the COVID-19 pandemic, which was when the labor market suffered most. The decline in real GDP annualized growth of -3% in Q2:2022 was the 5th worst and increase of +2.5% in Q3:2022 ranked 23rd in the country. 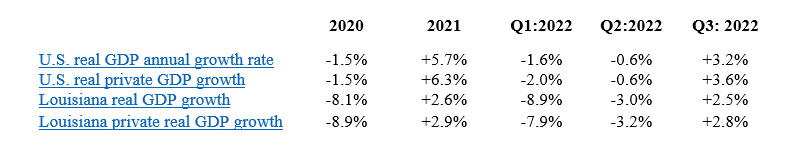 The BEA also reported that personal income in Louisiana grew at an annualized pace of +5.8% (ranked 19th) in Q2:2022 (tied +5.8% U.S. average) and of +2.5% (ranked 47th) in Q3:2022 (below +5.3% U.S. average). Bottom Line: Louisianans gained jobs in December but continue to feel the costs of the shutdowns in 2020 and other restrictive policies that reduce opportunities for them to find well-paid jobs. Institutions matter to human flourishing in countries and states, which is floundering in Louisiana compared with many other states. The Fraser Institute recently ranked Louisiana 20th for economic freedom based on 2020 data for government spending, taxes, and labor market regulation. And the Tax Foundation recently ranked the Pelican State as having the 12th worst business tax climate and 15th highest corporate income tax rate. While the state has improved its tax code recently and lower taxes may happen soon from an expected budget surplus, this lack of economic freedom and poor business tax climate are contributing to a net outmigration of Louisianans to other states, which is a drain on the state’s economic potential now and in the future. State and local policymakers should work to reverse this trend by passing pro-growth policies. 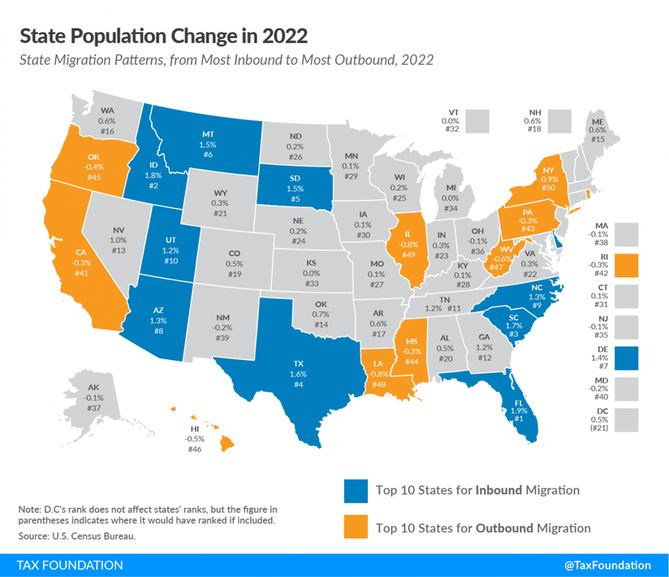 Free-Market Solutions: In 2023, the Louisiana Legislature should provide the state’s comeback story by:
|
Vance Ginn, Ph.D.
|

 RSS Feed
Proudly powered by Weebly